Redbox 2012 Annual Report Download - page 35
Download and view the complete annual report
Please find page 35 of the 2012 Redbox annual report below. You can navigate through the pages in the report by either clicking on the pages listed below, or by using the keyword search tool below to find specific information within the annual report.-
 1
1 -
2
-
3
-
4
-
5
-
6
-
7
-
8
-
9
-
10
-
11
-
12
-
13
-
14
-
15
-
16
-
17
-
18
-
19
-
20
-
21
-
22
-
23
-
24
-
 25
25 -
 26
26 -
 27
27 -
 28
28 -
 29
29 -
 30
30 -
 31
31 -
 32
32 -
 33
33 -
 34
34 -
 35
35 -
 36
36 -
 37
37 -
 38
38 -
 39
39 -
 40
40 -
 41
41 -
 42
42 -
 43
43 -
 44
44 -
 45
45 -
46
-
47
-
48
-
49
-
50
-
51
-
52
-
53
-
54
-
55
-
56
-
57
-
58
-
59
-
60
-
61
-
62
-
63
-
64
-
65
-
66
-
67
-
68
-
69
-
70
-
71
-
72
-
73
-
74
-
75
-
76
-
77
-
78
-
79
-
80
-
81
-
82
-
83
-
84
-
85
-
86
-
87
-
88
-
89
-
90
-
91
-
92
-
93
-
94
-
95
-
96
-
97
-
98
-
99
-
100
-
101
-
102
-
103
-
104
-
105
 |
 |

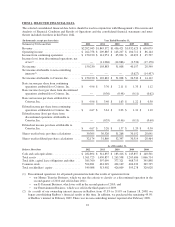
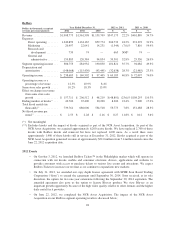
Redbox
Dollars in thousands, except net
revenue per rental amounts
Year Ended December 31, 2012 vs. 2011 2011 vs. 2010
2012 2011 2010 $ % $ %
Revenue ................. $1,908,773 $1,561,598 $1,159,709 $347,175 22.2% $401,889 34.7%
Expenses:
Direct operating ....... 1,340,899 1,134,167 859,774 206,732 18.2% 274,393 31.9%
Marketing ............ 20,497 22,041 14,231 (1,544) (7.0)% 7,810 54.9%
Research and
development ........ 739 74 — 665 NM* 74 —
General and
administrative ....... 159,885 120,384 94,854 39,501 32.8% 25,530 26.9%
Segment operating income . . . 386,753 284,932 190,850 101,821 35.7% 94,082 49.3%
Depreciation and
amortization ............ (148,068) (115,430) (93,445) (32,638) 28.3% (21,985) 23.5%
Operating income .......... $ 238,685 $ 169,502 $ 97,405 $ 69,183 40.8% $ 72,097 74.0%
Operating income as a
percentage of revenue .... 12.5% 10.9% 8.4%
Same store sales growth ..... 10.2% 18.3% 13.0%
Effect on change in revenue
from same store sales
growth ................ $ 157,711 $ 206,512 $ 98,219 $ (48,801) (23.6)% $108,293 110.3%
Ending number of kiosks** . . . 43,700 35,400 30,200 8,300 23.4% 5,200 17.2%
Total kiosk rentals (in
thousands)** ............ 739,761 686,006 534,518 53,775 7.8% 151,488 28.3%
Net kiosk revenue per
rental** ................ $ 2.55 $ 2.28 $ 2.16 $ 0.27 11.8% $ 0.12 5.6%
(*) Not meaningful
(**) Excludes kiosks and the impact of kiosks acquired as part of the NCR Asset Acquisition. As part of the
NCR Asset Acquisition, we acquired approximately 6,200 active kiosks. We have replaced 2,700 of these
kiosks with Redbox kiosks and removed but have not replaced 1,600 more. As a result there were
approximately 1,900 of these kiosks still in service at December 31, 2012. Kiosks acquired as part of the
NCR Asset Acquisition generated revenue of approximately $22.0 million from 7.4 million rentals since the
June 22, 2012 acquisition date.
2012 Events
• On October 3, 2012, we launched Redbox TicketsTM in the Philadelphia market which will operate in
connection with our kiosks, mobile and consumer electronic devices, applications and websites to
provide customers with access to purchase tickets to various live events and attractions. We expect
Redbox Tickets to increase our revenue as we continue to expand into new markets;
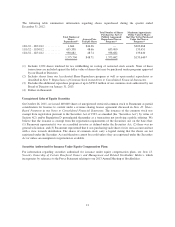
• On July 31, 2012, we amended our copy depth license agreement with SPHE Scan Based Trading
Corporation (“Sony”) to extend the agreement until September 30, 2014. Sony received, at its sole
discretion, the option for two one-year extensions following the September 30, 2014 expiration. The
amended agreement also gave us the option to license Blu-ray product. We view Blu-ray as an
important growth opportunity because of the high video quality relative to other formats and the higher
daily rental fee it provides;
• On June 22, 2012, we completed the NCR Asset Acquisition. The impact of the NCR Asset
Acquisition on our Redbox segment operating results is discussed below;
28