Redbox 2012 Annual Report Download - page 50
Download and view the complete annual report
Please find page 50 of the 2012 Redbox annual report below. You can navigate through the pages in the report by either clicking on the pages listed below, or by using the keyword search tool below to find specific information within the annual report.-
 1
1 -
2
-
3
-
4
-
5
-
6
-
7
-
8
-
9
-
10
-
11
-
12
-
13
-
14
-
15
-
16
-
17
-
18
-
19
-
20
-
21
-
22
-
23
-
24
-
25
-
26
-
27
-
28
-
29
-
30
-
31
-
32
-
33
-
34
-
35
-
36
-
37
-
38
-
39
-
 40
40 -
 41
41 -
 42
42 -
 43
43 -
 44
44 -
 45
45 -
 46
46 -
 47
47 -
 48
48 -
 49
49 -
 50
50 -
 51
51 -
 52
52 -
 53
53 -
 54
54 -
 55
55 -
 56
56 -
 57
57 -
 58
58 -
 59
59 -
 60
60 -
61
-
62
-
63
-
64
-
65
-
66
-
67
-
68
-
69
-
70
-
71
-
72
-
73
-
74
-
75
-
76
-
77
-
78
-
79
-
80
-
81
-
82
-
83
-
84
-
85
-
86
-
87
-
88
-
89
-
90
-
91
-
92
-
93
-
94
-
95
-
96
-
97
-
98
-
99
-
100
-
101
-
102
-
103
-
104
-
105
 |
 |

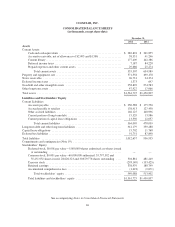
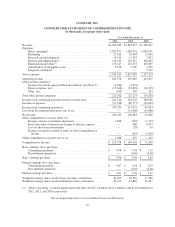
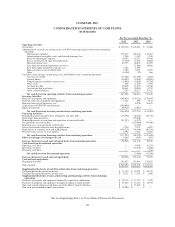
ITEM 8. FINANCIAL STATEMENTS AND SUPPLEMENTARY DATA
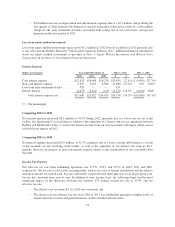
Unaudited quarterly financial data for each of the eight quarters in the two-year period ended December 31, 2012
is as follows:
2012 (In thousands, except per share data) 1st Quarter 2nd Quarter 3rd Quarter 4th Quarter
Revenue ........................................... $568,179 $532,220 $537,562 $564,082
Income from continuing operations before income taxes ..... $ 89,368 $ 61,650 $ 56,935 $ 33,793
Income tax expense .................................. (35,672) (24,775) (20,161) (10,908)
Income from continuing operations ..................... 53,696 36,875 36,774 22,885
Net income ........................................ $ 53,696 $ 36,875 $ 36,774 $ 22,885
Basic income per share from continuing operations ......... $ 1.76 $ 1.20 $ 1.21 $ 0.78
Basic net income per share ............................ $ 1.76 $ 1.20 $ 1.21 $ 0.78
Diluted income per share from continuing operations ....... $ 1.65 $ 1.11 $ 1.14 $ 0.75
Diluted net income per share .......................... $ 1.65 $ 1.11 $ 1.14 $ 0.75
Shares used in basic per share calculations ................ 30,590 30,776 30,454 29,380
Shares used in diluted per share calculations .............. 32,628 33,190 32,238 30,619
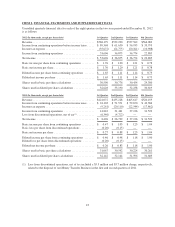
2011 (In thousands, except per share data) 1st Quarter 2nd Quarter 3rd Quarter 4th Quarter
Revenue ........................................... $424,072 $435,228 $465,617 $520,455
Income from continuing operations before income taxes ..... $ 24,103 $ 51,571 $ 59,670 $ 49,384
Income tax expense .................................. (9,261) (20,110) (22,544) (17,862)
Income from continuing operations ..................... 14,842 31,461 37,126 31,522
Loss from discontinued operations, net of tax(1) ............ (6,346) (4,722) — —
Net income ........................................ $ 8,496 $ 26,739 $ 37,126 $ 31,522
Basic income per share from continuing operations ......... $ 0.47 $ 1.03 $ 1.23 $ 1.04
Basic loss per share from discontinued operations .......... (0.20) (0.15) — —
Basic net income per share ............................ $ 0.27 $ 0.88 $ 1.23 $ 1.04
Diluted income per share from continuing operations ....... $ 0.46 $ 0.98 $ 1.18 $ 1.00
Diluted loss per share from discontinued operations ........ (0.20) (0.15) — —
Diluted net income per share .......................... $ 0.26 $ 0.83 $ 1.18 $ 1.00
Shares used in basic per share calculations ................ 31,067 30,542 30,224 30,261
Shares used in diluted per share calculations .............. 32,142 32,144 31,596 31,605
(1) Loss from discontinued operations, net of tax included a $5.3 million and $5.7 million charge, respectively,
related to the disposal of our Money Transfer Business in the first and second quarters of 2011.
43