Redbox 2012 Annual Report Download - page 40
Download and view the complete annual report
Please find page 40 of the 2012 Redbox annual report below. You can navigate through the pages in the report by either clicking on the pages listed below, or by using the keyword search tool below to find specific information within the annual report.-
 1
1 -
2
-
3
-
4
-
5
-
6
-
7
-
8
-
9
-
10
-
11
-
12
-
13
-
14
-
15
-
16
-
17
-
18
-
19
-
20
-
21
-
22
-
23
-
24
-
25
-
26
-
27
-
28
-
29
-
 30
30 -
 31
31 -
 32
32 -
 33
33 -
 34
34 -
 35
35 -
 36
36 -
 37
37 -
 38
38 -
 39
39 -
 40
40 -
 41
41 -
 42
42 -
 43
43 -
 44
44 -
 45
45 -
 46
46 -
 47
47 -
 48
48 -
 49
49 -
 50
50 -
51
-
52
-
53
-
54
-
55
-
56
-
57
-
58
-
59
-
60
-
61
-
62
-
63
-
64
-
65
-
66
-
67
-
68
-
69
-
70
-
71
-
72
-
73
-
74
-
75
-
76
-
77
-
78
-
79
-
80
-
81
-
82
-
83
-
84
-
85
-
86
-
87
-
88
-
89
-
90
-
91
-
92
-
93
-
94
-
95
-
96
-
97
-
98
-
99
-
100
-
101
-
102
-
103
-
104
-
105
 |
 |
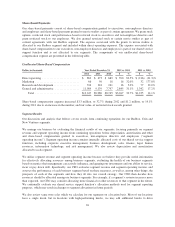
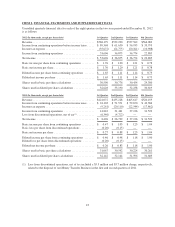
Comparing 2012 to 2011
Revenue increased $1.1 million, or 80.2% primarily due to an increased number of kiosks for the self-service
concepts offset by exiting one of our self-service concepts in the second quarter of 2011.
Operating loss increased $7.2 million, or 38.3%, primarily due to the following:
• $3.8 million increase in research and development expenses primarily due to the design, engineering,
software development and build out of new kiosks for market testing primarily in our coffee,
refurbished electronics, photo and other self-service concepts;
• $2.1 million increase in direct operating expenses primarily due to additional sales volume from
existing concepts, as well as the addition of self-service concepts to test markets, increased shared
services support costs related primarily to deployment of new kiosks and customer service related
activity that were not allocated to this segment in 2011; offsetting the increases was a $0.7 million
charge in the second quarter of 2011 for purchases of additional prototype kiosks, which we expensed
as acquired during the piloting phase, and the exit of one of our self-service concepts in the second
quarter of 2011;
• $1.5 million increase in general and administrative expenses primarily due to higher allocated expenses
from our shared services support group related to facilities expansion, human resource programs and
the continued implementation and maintenance of our ERP system as well as additional headcount to
support growth offset partially by the exit of one of our self-service concepts in the second quarter of
2011;
• $1.4 million increase in marketing expense due to preparations for rollout of Rubi, as well as early
stage preparations primarily for the potential rollout of our refurbished electronics and photo self-
service concepts and increased headcount to support business growth, offset partially by the exit of one
of our self-service concepts in the second quarter of 2011; and
• $0.5 million decrease in depreciation primarily due to loss on sale of assets from the exit of one of our
self-service concepts in the second quarter of 2011 partially offset by the depreciation of kiosks in our
coffee, refurbished electronics and photo self-service concepts beginning in the fourth quarter of 2012.
We expect to continue to invest in self-service concepts that meet our requirements and show the most promise
towards future success.
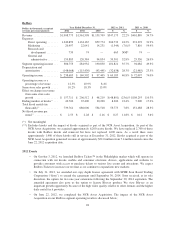
Comparing 2011 to 2010
Revenue increased $0.7 million, or 90.7% primarily due to an increased number of kiosks for new and existing
self-service concepts.
Operating loss increased $6.6 million, or 55.0% primarily due to the following:
• $4.5 million increase in general and administrative expenses due to increased headcount to support
growth of existing self-service concepts, as well as the start-up of new self-service concepts, higher
allocated costs from our shared service support functions and a $0.5 million charge associated with
exiting one of our self-service concept test programs during the second quarter of 2011;
• $3.6 million increase in research and development expenses associated with the design and build out of
new self-service concepts; and
• $1.9 million increase in direct operating expenses due to a $0.7 million charge for purchases of
additional prototype kiosks, which we expense as acquired during the piloting phase, additional sales
volume from existing concepts, as well as the addition of self-service concepts to test markets; partially
offset by a
33