Redbox 2012 Annual Report Download - page 39
Download and view the complete annual report
Please find page 39 of the 2012 Redbox annual report below. You can navigate through the pages in the report by either clicking on the pages listed below, or by using the keyword search tool below to find specific information within the annual report.-
 1
1 -
2
-
3
-
4
-
5
-
6
-
7
-
8
-
9
-
10
-
11
-
12
-
13
-
14
-
15
-
16
-
17
-
18
-
19
-
20
-
21
-
22
-
23
-
24
-
25
-
26
-
27
-
28
-
 29
29 -
 30
30 -
 31
31 -
 32
32 -
 33
33 -
 34
34 -
 35
35 -
 36
36 -
 37
37 -
 38
38 -
 39
39 -
 40
40 -
 41
41 -
 42
42 -
 43
43 -
 44
44 -
 45
45 -
 46
46 -
 47
47 -
 48
48 -
 49
49 -
50
-
51
-
52
-
53
-
54
-
55
-
56
-
57
-
58
-
59
-
60
-
61
-
62
-
63
-
64
-
65
-
66
-
67
-
68
-
69
-
70
-
71
-
72
-
73
-
74
-
75
-
76
-
77
-
78
-
79
-
80
-
81
-
82
-
83
-
84
-
85
-
86
-
87
-
88
-
89
-
90
-
91
-
92
-
93
-
94
-
95
-
96
-
97
-
98
-
99
-
100
-
101
-
102
-
103
-
104
-
105
 |
 |

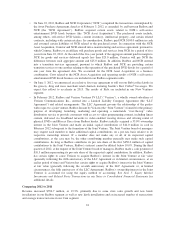
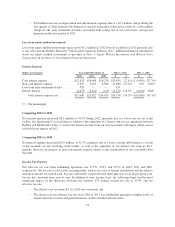
Comparing 2011 to 2010
Revenue increased $6.4 million, or 2.3%, primarily due to growth in larger than average coin-to-voucher
transactions and strengthening of our coin-to-prepaid product transactions, which typically have a larger
transaction size than coin to voucher transactions, resulting in a $0.98 increase in average transaction size to
$38.78. The increase in average transaction size was partially offset by a decline in total transactions of 612,000.
The combined impacts led to an increase in same store sales during the period of 2.1%.
Operating income increased $2.4 million, or 3.7% primarily due to the following:
• $6.4 million increase in revenue as described above;
• $2.9 million decrease in marketing expenses due to lower advertising spend on national promotions;
• $5.4 million decrease in litigation expense due to the settlement of patent litigation with ScanCoin
expensed during the first quarter of 2010; partially offset by a
• $6.4 million increase in direct operating expenses due to higher revenue share from revenue growth
and increased revenue share rates with certain retail partners as a result of long-term contract renewals;
higher kiosk field operations costs primarily from higher gasoline, leased vehicle and parts and
supplies expense; and increased allocated expenses from our shared services support function. These
increased expenses were partially offset by lower coin processing related expenses, including a credit
received from a vendor in 2011 for previously-processed mutilated coin;
• $3.3 million increase in general and administrative expenses arising from higher allocated expenses
from our shared service support functions to support overall business growth and strengthening of our
infrastructure, as well as expense related to an international tax assessment; and a
• $2.2 million increase in depreciation and amortization expenses primarily due to higher allocated
expenses from our shared service support function for data center expansion and ERP system
implementation costs, as well as higher depreciation from an increase in the number of kiosks deployed
primarily due to the new Safeway relationship we entered in 2011.
New Ventures
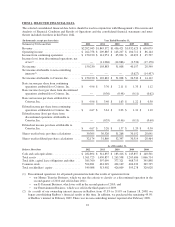
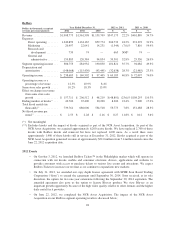
Dollars in thousands Year Ended December 31, 2012 vs. 2011 2011 vs. 2010
2012 2011 2010 $ % $ %
Revenue .......................... $ 2,509 $ 1,392 $ 730 $ 1,117 80.2% $ 662 90.7%
Expenses:
Direct operating ................ 5,475 3,349 1,493 2,126 63.5% 1,856 124.3%
Marketing ..................... 2,134 771 505 1,363 176.8% 266 52.7%
Research and development ....... 8,385 4,623 1,037 3,762 81.4% 3,586 345.8%
General and administrative ....... 11,999 10,464 5,918 1,535 14.7% 4,546 76.8%
Segment operating loss .............. (25,484) (17,815) (8,223) (7,669) 43.0% (9,592) 116.6%
Depreciation and amortization ........ (349) (866) (3,826) 517 (59.7)% 2,960 (77.4)%
Operating loss ..................... $(25,833) $(18,681) $(12,049) $(7,152) 38.3% $(6,632) 55.0%
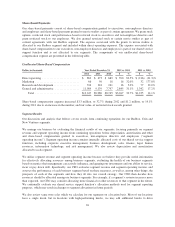
2012 Events
• On June 5, 2012, we announced an exclusive five-year agreement to roll out our Rubi coffee kiosks in
the grocery, drug and mass merchant retail channels featuring Seattle’s Best Coffee beverages. We
expect this rollout to accelerate in 2013.
32