Red Lobster 2011 Annual Report Download - page 45
Download and view the complete annual report
Please find page 45 of the 2011 Red Lobster annual report below. You can navigate through the pages in the report by either clicking on the pages listed below, or by using the keyword search tool below to find specific information within the annual report.-
 1
1 -
2
-
3
-
4
-
5
-
6
-
7
-
8
-
9
-
10
-
11
-
12
-
13
-
14
-
15
-
16
-
17
-
18
-
19
-
20
-
21
-
22
-
23
-
24
-
25
-
26
-
27
-
28
-
29
-
30
-
31
-
32
-
33
-
34
-
 35
35 -
 36
36 -
 37
37 -
 38
38 -
 39
39 -
 40
40 -
 41
41 -
 42
42 -
 43
43 -
 44
44 -
 45
45 -
 46
46 -
 47
47 -
 48
48 -
 49
49 -
 50
50 -
 51
51 -
 52
52 -
 53
53 -
 54
54 -
 55
55 -
56
-
57
-
58
-
59
-
60
-
61
-
62
-
63
-
64
-
65
-
66
-
67
-
68
-
69
-
70
-
71
-
72
-
73
-
74
-
75
-
76
-
77
-
78
 |
 |

›
2011 Annual Report 43
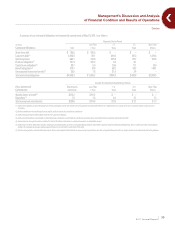
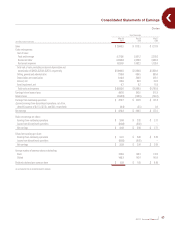
Consolidated Statements of Earnings
Darden
Fiscal Year Ended
May 29, May 30, May 31,
(in millions, except per share data) 2011 2010 2009
Sales $ 7,500.2 $ 7,113.1 $ 7,217.5
Costs and expenses:
Cost of sales:
Food and beverage 2,173.6 2,051.2 2,200.3
Restaurant labor 2,396.9 2,350.6 2,308.2
Restaurant expenses 1,129.0 1,082.2 1,128.4
Total cost of sales, excluding restaurant depreciation and
amortization of $295.6, $283.4, $267.1, respectively $ 5,699.5 $ 5,484.0 $ 5,636.9
Selling, general and administrative 738.0 684.5 665.6
Depreciation and amortization 316.8 300.9 283.1
Interest, net 93.6 93.9 107.4
Asset impairment, net 4.7 6.2 12.0
Total costs and expenses $ 6,852.6 $ 6,569.5 $ 6,705.0
Earnings before income taxes 647.6 543.6 512.5
Income taxes (168.9) (136.6) (140.7)
Earnings from continuing operations $ 478.7 $ 407.0 $ 371.8
(Losses) earnings from discontinued operations, net of tax
(benefit) expense of $(1.5), $(1.5), and $0.2, respectively (2.4) (2.5) 0.4
Net earnings $ 476.3 $ 404.5 $ 372.2
Basic net earnings per share:
Earnings from continuing operations $ 3.50 $ 2.92 $ 2.71
Losses from discontinued operations (0.02) (0.02) —
Net earnings $ 3.48 $ 2.90 $ 2.71
Diluted net earnings per share:
Earnings from continuing operations $ 3.41 $ 2.86 $ 2.65
Losses from discontinued operations (0.02) (0.02) —
Net earnings $ 3.39 $ 2.84 $ 2.65
Average number of common shares outstanding:
Basic 136.8 139.3 137.4
Diluted 140.3 142.4 140.4
Dividends declared per common share $ 1.28 $ 1.00 $ 0.80
See accompanying notes to consolidated financial statements.