Red Lobster 2011 Annual Report Download - page 30
Download and view the complete annual report
Please find page 30 of the 2011 Red Lobster annual report below. You can navigate through the pages in the report by either clicking on the pages listed below, or by using the keyword search tool below to find specific information within the annual report.-
 1
1 -
2
-
3
-
4
-
5
-
6
-
7
-
8
-
9
-
10
-
11
-
12
-
13
-
14
-
15
-
16
-
17
-
18
-
19
-
 20
20 -
 21
21 -
 22
22 -
 23
23 -
 24
24 -
 25
25 -
 26
26 -
 27
27 -
 28
28 -
 29
29 -
 30
30 -
 31
31 -
 32
32 -
 33
33 -
 34
34 -
 35
35 -
 36
36 -
 37
37 -
 38
38 -
 39
39 -
 40
40 -
41
-
42
-
43
-
44
-
45
-
46
-
47
-
48
-
49
-
50
-
51
-
52
-
53
-
54
-
55
-
56
-
57
-
58
-
59
-
60
-
61
-
62
-
63
-
64
-
65
-
66
-
67
-
68
-
69
-
70
-
71
-
72
-
73
-
74
-
75
-
76
-
77
-
78
 |
 |

Management’s Discussion and Analysis
of Financial Condition and Results of Operations
Darden
›
Darden Restaurants, Inc.
28
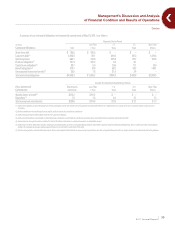
Olive Garden’s sales of $3.32 billion in fiscal 2010 were 1.0 percent above
fiscal 2009. Olive Garden opened 32 net new restaurants during fiscal 2010. On
a 52-week basis, annual U.S. same-restaurant sales for Olive Garden decreased
1.0 percent due to a 3.0 percent decrease in same-restaurant guest counts
partially offset by a 2.0 percent increase in average guest check. Average annual
sales per restaurant for Olive Garden were $4.7 million in fiscal 2010 compared
to $4.8 million in fiscal 2009 (52-week basis).
Red Lobster’s sales of $2.49 billion in fiscal 2010 were 5.3 percent below
fiscal 2009. Red Lobster opened four net new restaurants during fiscal 2010. On
a 52-week basis, annual U.S. same-restaurant sales for Red Lobster decreased
4.9 percent due to a 6.3 percent decrease in same-restaurant guest counts,
partially offset by a 1.4 percent increase in average guest check. Average annual
sales per restaurant for Red Lobster were $3.6 million in fiscal 2010 compared to
$3.8 million in fiscal 2009 (52-week basis).
LongHorn Steakhouse’s sales of $881.8 million in fiscal 2010 were 0.7 percent
below fiscal 2009. LongHorn Steakhouse opened 10 net new restaurants during
fiscal 2010. On a 52-week basis, annual same-restaurant sales for LongHorn
Steakhouse decreased 1.9 percent due to a 4.2 percent decrease in same-
restaurant guest counts, partially offset by a 2.3 percent increase in average
guest check. Average annual sales per restaurant for LongHorn Steakhouse were
$2.7 million in fiscal 2010 compared to $2.8 million in fiscal 2009 (52-week basis).
In total, our remaining brands generated sales of $422.0 million in fiscal
2010, which were 3.2 percent above fiscal 2009, primarily driven by three new
restaurants at The Capital Grille, one new restaurant at Bahama Breeze and
three new restaurants at Seasons 52. Additionally, sales growth reflected same-
restaurant sales decreases of 7.8 percent at The Capital Grille, 2.9 percent at
Bahama Breeze and 0.5 percent at Seasons 52. Average annual sales per
restaurant for The Capital Grille were $6.2 million in fiscal 2010 compared to
$6.8 million in fiscal 2009 (52-week basis). Average annual sales per restaurant
for Bahama Breeze were $5.4 million in fiscal 2010 compared to $5.5 million in
fiscal 2009 (52-week basis). Average annual sales per restaurant for Seasons 52
were $5.9 million in fiscal 2010 and fiscal 2009 (52-week basis).
COSTS AND EXPENSES
Total costs and expenses from continuing operations were $6.85 billion in fiscal
2011, $6.57 billion in fiscal 2010 and $6.70 billion in fiscal 2009. As a percent of
sales, total costs and expenses from continuing operations in fiscal 2011 were
91.4 percent, which decreased from 92.4 percent in fiscal 2010 and 92.9 percent
in fiscal 2009.
Food and beverage costs increased $122.4 million, or 6.0 percent, from
$2.05 billion in fiscal 2010 to $2.17 billion in fiscal 2011. Food and beverage costs
decreased $149.1 million, or 6.8 percent, from $2.20 billion in fiscal 2009 to
$2.05 billion in fiscal 2010. As a percent of sales, food and beverage costs increased
from fiscal 2010 to fiscal 2011 primarily as a result of higher seafood and other
commodity costs, partially offset by pricing. As a percent of sales, food and
beverage costs decreased from fiscal 2009 to fiscal 2010 primarily as a result
of lower seafood, beef and commodity costs and pricing.
Restaurant labor costs increased $46.3 million, or 2.0 percent, from
$2.35 billion in fiscal 2010 to $2.40 billion in fiscal 2011. Restaurant labor costs
increased $42.4 million, or 1.8 percent, from $2.31 billion in fiscal 2009 to
$2.35 billion in fiscal 2010. As a percent of sales, restaurant labor costs decreased
in fiscal 2011 primarily as a result of pricing, increased employee productivity,
lower manager incentive compensation, decreased employee insurance claims
costs and improved wage-rate management, partially offset by higher unemploy-
ment taxes. As a percent of sales, restaurant labor costs increased in fiscal 2010
primarily as a result of an increase in wage rates, manager compensation, employee
medical costs and the impact of sales deleveraging partially offset by productivity
gains and reduced turnover.
Restaurant expenses (which include utilities, repairs and maintenance, lease,
credit card, property tax, workers’ compensation, new restaurant pre-opening and
other restaurant-level operating expenses) increased $46.8 million, or 4.3 percent,
from $1.08 billion in fiscal 2010 to $1.13 billion in fiscal 2011. Restaurant expenses
decreased $46.2 million, or 4.1 percent, from $1.13 billion in fiscal 2009 to
$1.08 billion in fiscal 2010. As a percent of sales, restaurant expenses decreased
in fiscal 2011 as compared to fiscal 2010 primarily due to pricing and lower general
liability expenses partially offset by higher credit card fees. As a percent of sales,
restaurant expenses decreased in fiscal 2010 as compared to fiscal 2009 primarily
as a result of lower utility costs and repair and maintenance expenses, which
were partially offset by the impact of sales deleveraging.
Selling, general and administrative expenses increased $53.5 million, or
7.8 percent, from $684.5 million in fiscal 2010 to $738.0 million in fiscal 2011. Selling,
general and administrative expenses increased $18.9 million, or 2.8 percent, from
$665.6 million in fiscal 2009 to $684.5 million in fiscal 2010. As a percent of sales,
selling, general and administrative expenses increased from fiscal 2010 to fiscal
2011 primarily due to higher media expenses and compensation expenses partially
offset by sales leveraging. As a percent of sales, selling, general and administrative
expenses increased from fiscal 2009 to fiscal 2010 primarily as a result of unfavor-
able market-driven changes in fair value related to our non-qualified deferred
compensation plans, as well as an increase in advertising expenses, performance
incentive compensation and the impact of sales deleveraging.
Depreciation and amortization expense increased $15.9 million, or 5.3 percent,
from $300.9 million in fiscal 2010 to $316.8 million in fiscal 2011. Depreciation and
amortization expense increased $17.8 million, or 6.3 percent, from $283.1 million in
fiscal 2009 to $300.9 million in fiscal 2010. As a percent of sales, depreciation and
amortization expense decreased in fiscal 2011 primarily due to sales leveraging,
partially offset by the increase in depreciable assets related to new restaurants
and remodel activities. As a percent of sales, depreciation and amortization
expense increased in fiscal 2010 as a result of new restaurant openings, the
incremental depreciation associated with the new restaurant support center facility
and sales deleveraging.
Net interest expense decreased $0.3 million, or 0.3 percent, from $93.9 million
in fiscal 2010 to $93.6 million in fiscal 2011. Net interest expense decreased
$13.5 million, or 12.6 percent, from $107.4 million in fiscal 2009 to $93.9 million in
fiscal 2010. As a percent of sales, net interest expense decreased in fiscal 2011
compared to fiscal 2010 primarily as a result of lower average debt balances
associated with the repayment of a portion of our long-term debt and sales
leveraging, partially offset by the fiscal 2010 release of interest reserves associated
with the favorable resolution of tax matters in fiscal 2010. As a percent of sales,
net interest expense decreased in fiscal 2010 compared to fiscal 2009 primarily
as a result of lower average debt balances associated with the repayment of all
our short-term debt and the release of interest reserves associated with the
favorable resolution in the current year of prior year tax matters.