Red Lobster 2011 Annual Report Download
Download and view the complete annual report
Please find the complete 2011 Red Lobster annual report below. You can navigate through the pages in the report by either clicking on the pages listed below, or by using the keyword search tool below to find specific information within the annual report.-
 1
1 -
 2
2 -
 3
3 -
 4
4 -
 5
5 -
 6
6 -
 7
7 -
 8
8 -
 9
9 -
 10
10 -
 11
11 -
 12
12 -
13
-
14
-
15
-
16
-
17
-
18
-
19
-
20
-
21
-
22
-
23
-
24
-
25
-
26
-
27
-
28
-
29
-
30
-
31
-
32
-
33
-
34
-
35
-
36
-
37
-
38
-
39
-
40
-
41
-
42
-
43
-
44
-
45
-
46
-
47
-
48
-
49
-
50
-
51
-
52
-
53
-
54
-
55
-
56
-
57
-
58
-
59
-
60
-
61
-
62
-
63
-
64
-
65
-
66
-
67
-
68
-
69
-
70
-
71
-
72
-
73
-
74
-
75
-
76
-
77
-
78
 |
 |

2011 Annual Report
Table of contents
-
Page 1
2011 Annual Report -
Page 2
erformance As one of the world's largest restaurant companies, Darden is focused on performance - from the dining room to the boardroom. Our goal is to nourish and delight every guest we serve, make Darden a special place for every employee, supplier partner, and community partner, and reward every ... -
Page 3
... Return S&P 500 Percentile Ranking Sales (dollars in millions) Restaurants (rolling ten-year average at each ï¬scal year-end) $8,000 2,000 90% $7,000 1,800 75% $6,000 1,600 60% $5,000 1,400 45% 07 08 09* 10 11 07 08 09* 10 11 07 08 09* 10 11 Cash Flow from Operating... -
Page 4
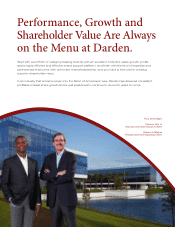
...' lives, Darden has delivered consistent, proï¬table market share growth and is well positioned to continue to do so for years to come. From Left to Right: Clarence Otis, Jr. Chairman and Chief Executive Ofï¬cer Andrew H. Madsen President and Chief Operating Ofï¬cer 2 Darden Restaurants... -
Page 5
... market share growth and a competitively superior total shareholder return. Fiscal 2011 Financial Highlights Buoyed by the return of same-restaurant sales growth and acceleration in new restaurant openings, Darden generated competitively superior sales and earnings growth in ï¬scal 2011 Sales... -
Page 6
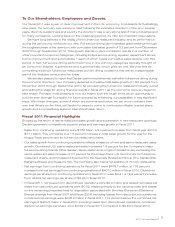
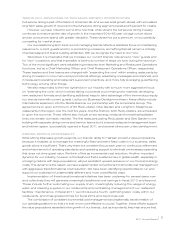
...of฀31฀net฀new฀restaurants฀and฀a฀U.S.฀ same-restaurant฀sales฀increase฀of฀1.2฀percent Red฀Lobster's฀total฀sales฀were฀$2.52฀billion,฀a฀1.3฀percent฀increase฀from฀fiscal฀2010.฀Average฀annual฀ sales฀per฀restaurant฀were฀$3.6฀million฀and... -
Page 7
... to open this summer. These efforts also include a new synergy restaurant format that facilitates entry into smaller domestic markets. The ï¬rst restaurant, pairing Red Lobster and Olive Garden in one building with separate dining rooms and service teams but a shared restaurant management team and... -
Page 8
... enterprise, brand and individual restaurant-level goals and objectives, why these make sense and each person's role in achieving them. Conclusion We operate in an industry that is part of the fabric of Americans' lives. Your Company has a dominant share position today, with total annual sales that... -
Page 9
Menu? What's on the › 2011 Annual Report 7 -
Page 10
rowth Darden has a long track record of growth and today enjoys the leading share of market in full-service dining. More importantly, we're doing what it takes to continue proï¬table market share growth going forward. 8 Darden Restaurants, Inc. -
Page 11
... in the combination of Brand Management and Restaurant Operations excellence, supported by unmatched expertise in a number of other areas that are critical to success in our industry - including Supply Chain, Talent Management, Technology and Finance. By building world-class capabilities in such... -
Page 12
... 2009, Darden's new Restaurant Support Center is home to the teams of professionals who make up our highly efï¬cient and effective restaurant support platform. Here, we incubate the strategies and realize the efï¬ciencies that come with being one of the world's largest restaurant companies. 10... -
Page 13
...exceeds expectations - to every guest, in every restaurant, every day. And to help ensure consistent application of proven best practices across all brands and elevate business building innovation across the enterprise, we recently created the Chief Marketing Ofï¬cer and Chief Restaurant Operations... -
Page 14
12 Darden Restaurants, Inc. -
Page 15
... attention. Our Supply Chain Automation initiative will enable us to leverage supply and demand information across our Supply Chain more effectively, creating signiï¬cant savings by doing an even better job of having the right product, at the right place, at the right time. 2011 Annual Report 13 -
Page 16
...180,000 employees as they deliver exceptional dining experiences for our guests and create dependable value for our shareholders. In 2011, the basis of that commitment was recognized by FORTUNE magazine when Darden became the ï¬rst full-service restaurant company to ever make the publication's list... -
Page 17
...commitment to making Darden a special place to be has led to internal promotion rates of 50 percent for restaurant managers and 99 percent for General Managers and Managing Partners. We've also outlined deï¬nitive career paths for all critical functions, because talented, engaged employees who have... -
Page 18
Our sales growth is built one restaurant at a time, across 1,894 restaurants in North America that serve more than 400 million meals a year. Darden's portfolio of category-leading brands captures a broad spectrum of guest occasions, creating the most extensive guest base in full-service dining. ... -
Page 19
... per year, Red Lobster is focused on addressing affordability considerations of current guests and making brand refresh efforts more visible to new guests. Red Lobster will address affordability through a balanced promotional calendar that offers price certainty and through core menu changes that... -
Page 20
... in full-service dining. Olive Garden is focused on further widening breadth of appeal to achieve its same-restaurant sales growth goal of three to four percent annually and build even stronger brand equity. The brand will continue to deliver promotions that have compelling food news and occasional... -
Page 21
... forward off its current base of 354 restaurants. And the brand will do it with an enhanced restaurant prototype that creates 50 additional seats and is capable of delivering a $500,000 increase in average unit sales for the same capital investment as the previous prototype. 2011 Annual Report 19 -
Page 22
... high-growth adult ambiance segment of the market. These consumers use Bahama Breeze for a variety of occasions and multiple day-parts, further extending the guest base served by the Darden portfolio. Bahama Breeze delivers an energizing experience with well above industry average beverage alcohol... -
Page 23
... personal service that includes customized menus, no matter how large the group, The Capital Grille's private dining rooms are equipped with state-of-the-art digital presentation systems that can accommodate multi-site business meetings using satellite broadcast technology. 2011 Annual Report... -
Page 24
... menus highlighting local ingredients and ï¬,avors, while maintaining its commitment to a 475 calorie limit for each menu item. Additionally, Seasons 52 is also building its group and event dining business by leveraging new customer relationship management tools. 22 Darden Restaurants, Inc. -
Page 25
Menu? What's on the › 2011 Annual Report 23 -
Page 26
... driving additional shareholder value by growing same-restaurant and new unit sales, expanding margins, increasing earnings and generating strong cash ï¬,ows. Comparison of Five-Year Total Return for Darden Restaurants, Inc., S&P 500 Stock Index and S&P Restaurants Index ឣ Darden Restaurants... -
Page 27
...on Internal Control Over Financial Reporting Report of Independent Registered Public Accounting Firm on Internal Control Over Financial Reporting Report of Independent Registered Public Accounting Firm Consolidated Statements of Earnings Consolidated Balance Sheets Consolidated Statements of Changes... -
Page 28
... (benefit) expense" on the consolidated statements of earnings found elsewhere in this report. In fiscal 2012, we expect to add approximately 80 to 90 net new restaurants. We expect blended U.S. same-restaurant sales in fiscal 2012 to increase approximately 2.5 percent for Olive Garden, Red Lobster... -
Page 29
... in same-restaurant guest counts. Average annual sales per restaurant for Olive Garden were $4.8 million in fiscal 2011 compared to $4.7 million in fiscal 2010. Red Lobster's sales of $2.52 billion in fiscal 2011 were 1.3 percent above last fiscal year, driven primarily by revenue from four net new... -
Page 30
... in average guest check. Average annual sales per restaurant for Olive Garden were $4.7 million in fiscal 2010 compared to $4.8 million in fiscal 2009 (52-week basis). Red Lobster's sales of $2.49 billion in fiscal 2010 were 5.3 percent below fiscal 2009. Red Lobster opened four net new restaurants... -
Page 31
...food and beverage costs and selling, general and administrative expenses as a percent of sales. Diluted net earnings per share growth for fiscal 2011 was impacted by the reduction of diluted net earnings per share in fiscal 2010 of approximately nine cents as a result of adjustments to our gift card... -
Page 32
... and Analysis of Financial Condition and Results of Operations Darden Land, Buildings and Equipment Land, buildings and equipment are recorded at cost less accumulated depreciation. Building components are depreciated over estimated useful lives ranging from 7 to 40 years using the straight-line... -
Page 33
...using a weighted-average cost of capital that reflects current market conditions. The projection uses management's best estimates of economic and market conditions over the projected period including growth rates in sales, costs and number of units, estimates of future expected changes in operating... -
Page 34
... operating environment for the restaurant industry may result in a future impairment loss. Changes in circumstances, existing at the measurement date or at other times in the future, or in the numerous estimates associated with management's judgments and assumptions made in assessing the fair value... -
Page 35
... base our estimates on the best available information at the time that we prepare the provision. We generally file our annual income tax returns several months after our fiscal year end. For U.S. federal income tax purposes, we participate in the Internal Revenue Service's (IRS) Compliance Assurance... -
Page 36
...October฀2037;฀and An฀unsecured,฀variable฀rate฀$8.0฀million฀commercial฀bank฀loan฀due฀in฀ December 2018 that is used to support a loan from us to the Employee Stock Ownership Plan (ESOP) portion of the Darden Savings Plan. During fiscal 2011, we repaid, at maturity, our $150... -
Page 37
... deferred compensation plan through fiscal 2021. (5) Includes interest on unrecognized income tax benefits of $3.1 million, $0.4 million of which relates to contingencies expected to be resolved within one year. (6) Includes letters of credit for $96.4 million of workers' compensation and general... -
Page 38
... tax payments in fiscal 2009 and 2010, relates to the application of the overpayment of income taxes in prior years to fiscal 2009 and 2010 tax liabilities. Net cash flows used in investing activities from continuing operations were $552.7 million, $428.7 million and $562.4 million in fiscal 2011... -
Page 39
... long-term rate of return on plan assets and expected health care cost trend rates. We set the discount rate assumption annually for each plan at its valuation date to reflect the yield of high quality fixed-income debt instruments, with lives that approximate the maturity of the plan benefits. At... -
Page 40
...earnings per share growth, and capital expenditures in fiscal 2011, and all other statements that are not historical facts, including without limitation statements with respect to the financial condition, results of operations, plans, objectives, future performance and business of Darden Restaurants... -
Page 41
... further investments in these brands฀and฀result฀in฀losses฀and฀impairments A฀lack฀of฀suitable฀new฀restaurant฀locations฀or฀a฀decline฀in฀the฀quality฀of฀ the฀locations฀of฀our฀current฀restaurants Higher-than-anticipated฀costs฀to฀open,฀close... -
Page 42
... because of changes in conditions, or that the degree of compliance with the policies or procedures may deteriorate. Management assessed the effectiveness of the Company's internal control over financial reporting as of May 29, 2011. In making this assessment, management used the criteria set forth... -
Page 43
... accordance with the standards of the Public Company Accounting Oversight Board (United States), the consolidated balance sheets of Darden Restaurants, Inc. as of May 29, 2011 and May 30, 2010, and the related consolidated statements of earnings, changes in stockholders' equity and accumulated other... -
Page 44
... Public Accounting Firm Darden The Board of Directors and Stockholders Darden Restaurants, Inc. We have audited the accompanying consolidated balance sheets of Darden Restaurants, Inc. and subsidiaries as of May 29, 2011 and May 30, 2010, and the related consolidated statements of earnings, changes... -
Page 45
Consolidated Statements of Earnings Darden Fiscal Year Ended May 30, 2010 (in millions, except per share data) May 29, 2011 May 31, 2009 Sales Costs and expenses: Cost of sales: Food and beverage Restaurant labor Restaurant expenses Total cost of sales, excluding restaurant depreciation and ... -
Page 46
... Deferred income taxes Total current assets Land, buildings and equipment, net Goodwill Trademarks Other assets Total assets Liabilities and Stockholders' Equity Current liabilities: Accounts payable Short-term debt Accrued payroll Accrued income taxes Other accrued taxes Unearned revenues Current... -
Page 47
... Stock option exercises (2.3 shares) Stock-based compensation ESOP note receivable repayments Income tax benefits credited to equity Purchases of common stock for treasury (8.6 shares) Issuance of treasury stock under Employee Stock Purchase Plan and other plans (0.2 shares) Balances at May 29, 2011... -
Page 48
...loan costs Stock-based compensation expense Change in current assets and liabilities Contributions to pension and postretirement plan Loss on disposal of land, buildings and equipment Change in cash surrender value of trust-owned life insurance Deferred income taxes Change in deferred rent Change in... -
Page 49
... statements relate to our continuing operations. RECLASSIFICATION Prior to the fourth quarter of fiscal 2011, we incorrectly reported our workers compensation and general liability accruals, net of expected recoveries, as a component of other current liabilities on our consolidated balance sheets... -
Page 50
... buildings and equipment, net, are amortized over the lesser of the expected lease term, including cancelable option periods, or the estimated useful lives of the related assets using the straight-line method. Equipment is depreciated over estimated useful lives ranging from 2 to 10 years also using... -
Page 51
...is discounted using a weighted-average cost of capital that reflects current market conditions. The projection uses management's best estimates of economic and market conditions over the projected period including growth rates in sales, costs and number of units, estimates of future expected changes... -
Page 52
...consolidated statements of earnings, represents food and beverage product sold and is presented net of discounts, coupons, employee meals and complimentary meals and gift cards. Revenue from restaurant sales is recognized when food and beverage products are sold. Sales taxes collected from customers... -
Page 53
... to manage interest rate, compensation, commodities pricing and foreign currency exchange rate risks inherent in our business operations. Our use of derivative instruments is currently limited to interest฀rate฀hedges;฀equity฀forwards฀contracts;฀commodities฀futures฀and฀ options... -
Page 54
... amortization expense on our consolidated statements of earnings. PRE-OPENING EXPENSES Non-capital expenditures associated with opening new restaurants are expensed as incurred. ADVERTISING Production costs of commercials are charged to operations in the fiscal period the advertising is first aired... -
Page 55
... operated the Red Lobster, Olive Garden, LongHorn Steakhouse, The Capital Grille, Bahama Breeze and Seasons 52 restaurant brands in North America as operating segments. The brands operate principally in the U.S. within the full-service dining industry, providing similar products to similar customers... -
Page 56
... exceeded their fair value. Fair value is generally determined based on appraisals or sales prices of comparable assets and estimates of future cash flows. The results of operations for all Red Lobster, Olive Garden and LongHorn Steakhouse restaurants permanently closed in fiscal 2011, 2010 and 2009... -
Page 57
Notes to Consolidated Financial Statements Darden NOTE 8 OTHER CURRENT LIABILITIES The components of other current liabilities are as follows: (in millions) May 29, 2011 May 30, 2010 Non-qualified deferred compensation plan Sales and other taxes Insurance-related Employee benefits Derivative ... -
Page 58
... We use financial and commodities derivatives to manage interest rate, equity-based compensation and commodities pricing and foreign currency exchange rate risks inherent in our business operations. By using these instruments, we expose ourselves, from time to time, to credit risk and market risk... -
Page 59
... and 2016. We did not elect hedge accounting with the expectation that changes in the fair value of the equity forward contracts would offset changes in the fair value of the performance stock units and Darden stock investments in the non-qualified deferred compensation plan within selling, general... -
Page 60
... consolidated statements of earnings are as follows: Location of Gain (Loss) Recognized in Earnings Amount of Gain (Loss) Recognized in Earnings Fiscal Year (in millions) 2011 2010 2009 Commodity contracts Equity forwards Equity forwards Cost of sales(1) Cost of sales(2) Selling, general and... -
Page 61
... futures, swaps and options is based on closing market prices of the contracts, inclusive of the risk of nonperformance. (4) The fair value of our equity forwards is based on the closing market value of Darden stock, inclusive of the risk of nonperformance. (5) The fair value of our interest rate... -
Page 62
...2011: Gross Unrealized Gains Gross Unrealized Losses Market Value (in millions) Cost Available-for-sale securities $31.4฀ $0.7฀ $-฀ $32.1 STOCKHOLDERS' RIGHTS PLAN Under our Rights Agreement dated May 16, 2005, each share of our common stock has associated with it one right to purchase... -
Page 63
...to Consolidated Financial Statements Darden The annual future lease commitments under capital lease obligations and noncancelable operating leases, including those related to restaurants reported as discontinued operations, for each of the five fiscal years subsequent to May 29, 2011 and thereafter... -
Page 64
...of limitations was as follows: 2011 Fiscal Year 2010 2009 Accrued liabilities Compensation and employee benefits Deferred rent and interest income Other Gross deferred tax assets Trademarks and other acquisition related intangibles Buildings and equipment Capitalized software and other assets Other... -
Page 65
... benefit plan that provides health care benefits to our salaried retirees. Fundings related to the defined benefit pension plans and postretirement benefit plans, which are funded on a pay-as-you-go basis, were as follows: (in millions) 2011 Fiscal Year 2010 2009 Defined benefit pension plans... -
Page 66
... benefit obligations at May 29 and May 30(1) Discount rate Rate of future compensation increases Weighted-average assumptions used to determine net expense for fiscal years ended May 29 and May 30(2) Discount rate Expected long-term rate of return on plan assets Rate of future compensation increases... -
Page 67
... We set the discount rate assumption annually for each of the plans at their valuation dates to reflect the yield of high-quality fixed-income debt instruments, with lives that approximate the maturity of the plan benefits. The expected longterm rate of return on plan assets and health care cost... -
Page 68
... return purposes. Stocks received from private equity distributions are valued by the trustee at closing prices from national exchanges on the valuation date. Investments in private companies are valued by management based upon information provided by the respective third-party investment manager... -
Page 69
... & Real Estate Real Asset Securities Public Sector Private Funds (in millions) Total Beginning balance at May 30, 2010 Actual return on plan assets: Relating to assets still held at the reporting date Relating to assets sold during the period Purchases, sales, and settlements Transfers in and/or... -
Page 70
... date of grant. Performance Stock Units granted under the 2002 Plan generally vest over a three-year period, and vested amounts may range from 0.0 to 150.0 percent of targeted amounts depending on the achievement of certain sales and diluted net earnings per share performance measures. Darden stock... -
Page 71
... our stock plans. This cost is expected to be recognized over a weighted-average period of 1.7 years. The total fair value of stock options that vested during fiscal 2011 was $18.8 million. Restricted stock and RSUs are granted at a value equal to the market price of our common stock on the date of... -
Page 72
... 3.6 million shares are available for purchase by employees at a purchase price that is 85.0 percent of the fair market value of our common stock on either the first or last trading day of each calendar quarter, whichever is lower. Cash received from employees pursuant to the plan during fiscal 2011... -
Page 73
... in sales associated with a correction to our third quarter estimate of gift card breakage, which reduced earnings from continuing operations and net earnings by $7.8 million, or approximately $0.05 reduction to diluted net earnings per share from continuing operations. 2011 Annual Report 71... -
Page 74
...Diluted net earnings per share: Earnings from continuing operations (Losses) earnings from discontinued operations Net earnings Average number of common shares outstanding: Basic Diluted Financial Position Total assets(1) Land, buildings and equipment, net Working capital (deficit)(1) Long-term debt... -
Page 75
... operator. Retired Vice Chairman and Chief Executive Officer of Choice Hotels International, a lodging franchisor. Michael D. Rose Chairman of the Board of First Horizon National Corporation, a national financial services company and Chairman of the Board of Midaro Investments, Inc., a privately... -
Page 76
...Senior Vice President, Chief Marketing Officer Valerie Insignares Senior Vice President, Chief Restaurant Operations Officer Barry Moullet Senior Vice President, Chief Supply Chain Officer Brad Richmond Senior Vice President, Chief Financial Officer John Caron President, Olive Garden Eugene Lee... -
Page 77
... New York Stock Exchange Stock Exchange Symbol: DRI Form 10-K Report Shareholders may request a free copy of our Form 10-K, including schedules but excluding exhibits, by writing to: Investor Relations, Darden Restaurants, Inc. P.O. Box 695011, Orlando, FL 32869-5011 Forward-Looking Statements... -
Page 78
1000 Darden Center Drive Orlando, FL 32837 407-245-4000 www.darden.com