Panasonic 2012 Annual Report Download - page 4
Download and view the complete annual report
Please find page 4 of the 2012 Panasonic annual report below. You can navigate through the pages in the report by either clicking on the pages listed below, or by using the keyword search tool below to find specific information within the annual report.-
 1
1 -
 2
2 -
 3
3 -
 4
4 -
 5
5 -
 6
6 -
 7
7 -
 8
8 -
 9
9 -
 10
10 -
 11
11 -
 12
12 -
 13
13 -
 14
14 -
 15
15 -
16
-
17
-
18
-
19
-
20
-
21
-
22
-
23
-
24
-
25
-
26
-
27
-
28
-
29
-
30
-
31
-
32
-
33
-
34
-
35
-
36
-
37
-
38
-
39
-
40
-
41
-
42
-
43
-
44
-
45
-
46
-
47
-
48
-
49
-
50
-
51
-
52
-
53
-
54
-
55
-
56
-
57
-
58
-
59
-
60
-
61
 |
 |

To Our
Stakeholders Top Message Segment
Information
Highlights Corporate
Governance
Financial
Highlights
Performance
Summary
Financial and
Corporate Data
R&D Design
Development
Intellectual
Property
Environmental
Activities
(Trillions of yen)
Domestic
*Payout ratios have not been presented for those fiscal
years in which the Company incurred a net loss attributable
to Panasonic Corporation.
Overseas
(Billions of yen) (%)
Operating Profit [left scale]
Operating Profit/Sales Ratio [right scale]
(Trillions of yen) (%)
Panasonic Corporation Shareholders’ Equity [left scale]
ROE [right scale]
(Billions of yen) (%)
Net Income Attributable to Panasonic Corporation [left scale]
Net Income Attributable to Panasonic
Corporation/Sales Ratio [right scale]
(Billions of yen)
Free Cash Flow
(Billions of yen)
Capital Investment
Depreciation
(Yen) (%)
Dividends Declared per Share [left scale]
Payout Ratio [right scale]
(Billions of yen) (%)
R&D Expenditures [left scale]
R&D Expenditures/Sales Ratio [right scale]
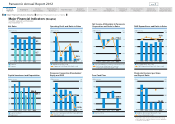
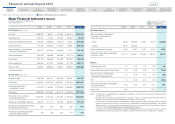
Net Sales Operating Profit and Ratio to Sales
Net Income Attributable to Panasonic
Corporation and Ratio to Sales R&D Expenditures and Ratio to Sales
Panasonic Corporation Shareholders’
Equity and ROE
Dividends Declared per Share
and Payout Ratio Free Cash FlowCapital Investment and Depreciation
Panasonic Corporation and Subsidiaries
Years ended March 31
Major Financial Indicators (Graphs)
Major Financial Indicators (Graphs) Major Financial Indicators (Tables)
10
8
6
4
2
0
600
400
200
0
6.0
4.0
2.0
0
4
3
2
1
0
40.0
20.0
0
−20.0
−40.0
40.0
30.0
20.0
10.0
0
500
400
300
200
100
0
40
30
20
10
0
600
400
200
0
–200
–400
800
600
400
200
0
8.0
6.0
4.0
2.0
0
2008 2009 2010 2011 2012
7.8
4.1
3.7
2008 2009 2010 2011 2012
0.6%
43.7
300
0
−300
−600
−900
4.0
0
−4.0
−8.0
−12.0
2008 2009 2010 2011 2012
–9.8%
–772.2
2008 2009 2010 2011 2012
6.6%
520.2
2008 2009 2010 2011 2012
294.8
259.1
–34.4%
2008 2009 2010 2011 2012 2008 2009 2010 2011 2012 2008 2009* 2010* 2011 2012*
–339.9
10.00
1.9
Panasonic Annual Report 2012 Search Contents Return Next
page 3