PNC Bank 2004 Annual Report Download - page 35
Download and view the complete annual report
Please find page 35 of the 2004 PNC Bank annual report below. You can navigate through the pages in the report by either clicking on the pages listed below, or by using the keyword search tool below to find specific information within the annual report.-
 1
1 -
2
-
3
-
4
-
5
-
6
-
7
-
8
-
9
-
10
-
11
-
12
-
13
-
14
-
15
-
16
-
17
-
18
-
19
-
20
-
21
-
22
-
23
-
24
-
 25
25 -
 26
26 -
 27
27 -
 28
28 -
 29
29 -
 30
30 -
 31
31 -
 32
32 -
 33
33 -
 34
34 -
 35
35 -
 36
36 -
 37
37 -
 38
38 -
 39
39 -
 40
40
 |
 |

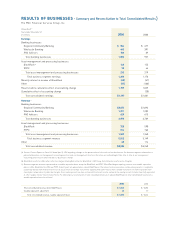
RESULTS OF BUSINESSES - Summary and Reconciliation to Total Consolidated Results}
The PNC Financial Services Group, Inc.
(Unaudited) (a)
Year ended December 31
In millions 2004 2003
Earnings
Banking businesses
Regional Community Banking $ 504 $ 477
Wholesale Banking 443 391
PNC Advisors 106 89
Total banking businesses 1,053 957
Asset management and processing businesses
BlackRock (b) 143 155
PFPC 70 64
Total asset management and processing businesses 213 219
Total business segment earnings 1,266 1,176
Minority interest in income of BlackRock (42) (47)
Other (27) (100)
Results before cumulative effect of accounting change 1,197 1,029
Cumulative effect of accounting change (28)
Total consolidated earnings $1,197 $1,001
Revenue (c)
Banking businesses
Regional Community Banking $2,073 $1,892
Wholesale Banking 1,271 1,282
PNC Advisors 629 615
Total banking businesses 3,973 3,789
Asset management and processing businesses
BlackRock 725 598
PFPC 814 762
Total asset management and processing businesses 1,539 1,360
Total business segment revenue 5,512 5,149
Other 40 114
Total consolidated revenue $5,552 $5,263
(a) See our Current Report on Form 8-K dated April 5, 2004 regarding changes to the presentation of the results of our businesses. Our business segment information is
presented based on our management accounting practices and our management structure. We refine our methodologies from time to time as our management
accounting practices are enhanced and our businesses change.
(b) BlackRock results for 2004 reflect after-tax charges totaling $66 million for BlackRock’s 2002 Long-Term Retention and Incentive Program.
(c) Business segment revenue is presented on a taxable-equivalent basis except for BlackRock and PFPC. BlackRock began reporting revenue on a taxable-equivalent
basis in 2004. BlackRock for 2003 and PFPC for both years are presented on a book (GAAP) basis. The interest income earned on certain earning assets is completely
or partially exempt from federal income tax. As such, these tax-exempt instruments typically yield lower returns than a taxable investment. In order to provide more
meaningful comparisons of yields and margins for all earning assets, we have increased the interest income earned on tax-exempt assets to make them fully equivalent
to other taxable interest income investments. The following is a reconciliation of total consolidated revenue on a book (GAAP) basis to total consolidated revenue on a
taxable-equivalent basis (in millions):
2004 2003
Total consolidated revenue, book (GAAP) basis $ 5,532 $ 5,253
Taxable-equivalent adjustment 20 10
Total consolidated revenue, taxable-equivalent basis $ 5,552 $ 5,263