PNC Bank 2004 Annual Report Download - page 3
Download and view the complete annual report
Please find page 3 of the 2004 PNC Bank annual report below. You can navigate through the pages in the report by either clicking on the pages listed below, or by using the keyword search tool below to find specific information within the annual report.-
 1
1 -
 2
2 -
 3
3 -
 4
4 -
 5
5 -
 6
6 -
 7
7 -
 8
8 -
 9
9 -
 10
10 -
 11
11 -
 12
12 -
 13
13 -
 14
14 -
15
-
16
-
17
-
18
-
19
-
20
-
21
-
22
-
23
-
24
-
25
-
26
-
27
-
28
-
29
-
30
-
31
-
32
-
33
-
34
-
35
-
36
-
37
-
38
-
39
-
40
 |
 |
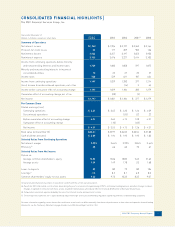
CONSOLIDATED FINANCIAL HIGHLIGHTS}
The PNC Financial Services Group, Inc.
2004 PNC Summary Annual Report 1
Year ended December 31
Dollars in millions, except per share data 2004 2003 2002 2001(a) 2000
Summary of Operations
Net interest income $1,969 $1,996 $2,197 $2,262 $2,164
Provision for credit losses 52 177 309 903 136
Noninterest income 3,563 3,257 3,197 2,652 2,950
Noninterest expense 3,735 3,476 3,227 3,414 3,103
Income from continuing operations before minority
and noncontrolling interests and income taxes 1,745 1,600 1,858 597 1,875
Minority and noncontrolling interests in income of
consolidated entities 10 32 37 33 27
Income taxes 538 539 621 187 634
Income from continuing operations 1,197 1,029 1,200 377 1,214
(Loss) Income from discontinued operations, net of tax (16) 5 65
Income before cumulative effect of accounting change 1,197 1,029 1,184 382 1,279
Cumulative effect of accounting change, net of tax (28) (5)
Net income $1,197 $1,001 $1,184 $ 377 $1,279
Per Common Share
Diluted earnings (loss)
Continuing operations $ 4.21 $ 3.65 $ 4.20 $ 1.26 $ 4.09
Discontinued operations (.05) .02 .22
Before cumulative effect of accounting change 4.21 3.65 4.15 1.28 4.31
Cumulative effect of accounting change (.10) (.02)
Net income $ 4.21 $ 3.55 $ 4.15 $ 1.26 $ 4.31
Book value (at December 31) $26.41 $23.97 $24.03 $20.54 $21.88
Cash dividends declared $ 2.00 $ 1.94 $ 1.92 $ 1.92 $ 1.83
Selected Ratios From Continuing Operations
Net interest margin 3.22% 3.64% 3.99% 3.84% 3.64%
Efficiency (b) 68 66 60 70 61
Selected Ratios From Net Income
Return on
Average common shareholders’ equity 16.82 15.06 18.83 5.65 21.63
Average assets 1.59 1.49 1.78 .53 1.68
Loans to deposits 82 80 79 80 106
Leverage (c) 7.6 8.2 8.1 6.8 8.0
Common shareholders’ equity to total assets 9.36 9.73 10.32 8.35 9.07
Certain prior-period amounts have been reclassified to conform with the current year presentation.
(a) Results for 2001 reflected the cost of actions taken during the year to accelerate the repositioning of PNC’s institutional lending business and other strategic initiatives.
Charges recognized in connection with these actions totaled $1.2 billion pretax and reduced 2001 net income by $768 million or $2.65 per diluted share.
(b) Computed as noninterest expense divided by the sum of net interest income and noninterest income.
(c) The leverage ratio represents tier 1 capital divided by adjusted average total assets as defined by regulatory capital requirements for bank holding companies.
For more information regarding certain factors that could cause actual results to differ materially from historical performance or from those anticipated in forward-looking
statements, see the Cautionary Statement on page 34 and in our 2004 Annual Report on Form 10-K.