North Face 2002 Annual Report Download - page 43
Download and view the complete annual report
Please find page 43 of the 2002 North Face annual report below. You can navigate through the pages in the report by either clicking on the pages listed below, or by using the keyword search tool below to find specific information within the annual report.
61
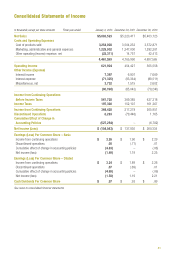
Consolidated Statements of Income
In thousands, except per share amounts Fiscal year ended January 4, 2003 December 29, 2001 December 30, 2000
Net Sales $5,083,523 $5,220,417 $5,403,123
Costs and Operating Expenses
Cost of products sold 3,254,008 3,504,233 3,572,871
Marketing, administrative and general expenses 1,229,902 1,247,000 1,282,281
Other operating (income) expense, net (22,311) 14,757 42,413
4,461,599 4,765,990 4,897,565
Operating Income 621,924 454,427 505,558
Other Income (Expense)
Interest income 7,397 6,807 7,669
Interest expense (71,325) (93,364) (88,511)
Miscellaneous, net 3,732 1,515 2,602
(60,196) (85,042) (78,240)
Income from Continuing Operations
Before Income Taxes 561,728 369,385 427,318
Income Taxes 197,300 152,107 161,367
Income from Continuing Operations 364,428 217,278 265,951
Discontinued Operations 8,283 (79,448) 1,165
Cumulative Effect of Change in
Accounting Policies (527,254) – (6,782)
Net Income (Loss) $(154,543) $ 137,830 $ 260,334
Earnings (Loss) Per Common Share – Basic
Income from continuing operations $ 3.26 $ 1.90 $ 2.29
Discontinued operations .08 (.71) .01
Cumulative effect of change in accounting policies (4.83) – (.06)
Net income (loss) (1.49) 1.19 2.25
Earnings (Loss) Per Common Share – Diluted
Income from continuing operations $ 3.24 $ 1.89 $ 2.26
Discontinued operations .07 (.69) .01
Cumulative effect of change in accounting policies (4.69) – (.06)
Net income (loss) (1.38) 1.19 2.21
Cash Dividends Per Common Share $ .97 $ .93 $ .89
See notes to consolidated financial statements.


