North Face 2002 Annual Report Download - page 33
Download and view the complete annual report
Please find page 33 of the 2002 North Face annual report below. You can navigate through the pages in the report by either clicking on the pages listed below, or by using the keyword search tool below to find specific information within the annual report.-
 1
1 -
2
-
3
-
4
-
5
-
6
-
7
-
8
-
9
-
10
-
11
-
12
-
13
-
14
-
15
-
16
-
17
-
18
-
19
-
20
-
21
-
22
-
 23
23 -
 24
24 -
 25
25 -
 26
26 -
 27
27 -
 28
28 -
 29
29 -
 30
30 -
 31
31 -
 32
32 -
 33
33 -
 34
34 -
 35
35 -
 36
36 -
 37
37 -
 38
38 -
 39
39 -
 40
40 -
 41
41 -
 42
42 -
 43
43 -
44
-
45
-
46
-
47
-
48
-
49
-
50
-
51
-
52
-
53
-
54
-
55
-
56
-
57
-
58
-
59
-
60
-
61
-
62
-
63
-
64
-
65
-
66
-
67
-
68
-
69
-
70
-
71
-
72
 |
 |

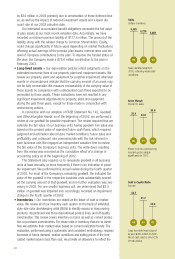
2002 compared with the prior year, while a stronger U.S. dollar had a $.02 negative impact in 2001 compared
with the prior year. The acquisitions of The North Face, Eastpak and H.I.S businesses in 2000 had a $.09 per
share positive impact on 2001 results relative to 2000.
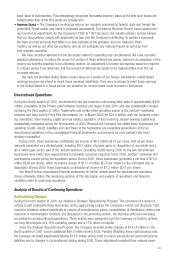
The operating results of continuing operations include the costs of the 2001/2002 Strategic Repositioning
Program and of the 2000 restructuring actions discussed above. These operating results also include the reversal
of certain restructuring liabilities no longer required due to changes in circumstances and include gains on sale of
closed facilities. In our internal evaluation of our operating results, including information presented to our Board of
Directors, we present the restructuring charges incurred, along with adjustments and gains directly related to
those restructuring actions, separately from the operating results of our individual business units. Operating results
presented exclusive of net restructuring charges is a measurement of financial performance that is not intended
as an alternative to generally accepted accounting principles. However, we believe that exclusion of these net
restructuring costs provides useful information for comparing historical results for the periods presented and a
basis for comparison with future periods.
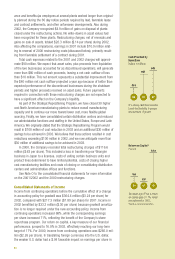
Excluding the effects of these net restructuring costs, income from continuing operations was $380.9 million
($3.38 per share) in 2002, compared with $298.6 million ($2.60 per share) in 2001 and $339.3 million ($2.89
per share) in 2000. The items related to these restructuring actions, and the income statement lines affected by
their inclusion, are as follows:
2002 2001 2000
Pretax Pretax Pretax
In thousands, except per share amounts Amount EPS Amount EPS Amount EPS
Earnings per share from continuing operations,
excluding restructuring and related items $3.38 $2.60 $2.89
Restructuring and related items:
Restructuring charges $(46,012) (.25) $(125,365) (.77) $(116,565) (.63)
Reversal of prior years’
restructuring charges 14,787 .08 10,947 .06 –
Gains on sale of closed
facilities 4,883 .03 – –
Earnings per share from continuing
operations, as reported $3.24 $1.89 $2.26
Restructuring charges:
Cost of products sold $(32,089) $ (72,694) $ (53,645)
Marketing, administrative
and general expenses (13,923) (48,708) (36,089)
Other operating
expense, net – (3,963) (26,831)
$(46,012) $(125,365) $(116,565)
Reversal of prior years’
restructuring charges:
Cost of products sold $ 9,358 $ 8,951
Marketing, administrative
and general expenses 5,429 1,996
$ 14,787 $ 10,947
Gains on sale of closed facilities:
Cost of products sold $ 4,883
51