North Face 2002 Annual Report Download - page 30
Download and view the complete annual report
Please find page 30 of the 2002 North Face annual report below. You can navigate through the pages in the report by either clicking on the pages listed below, or by using the keyword search tool below to find specific information within the annual report.-
 1
1 -
2
-
3
-
4
-
5
-
6
-
7
-
8
-
9
-
10
-
11
-
12
-
13
-
14
-
15
-
16
-
17
-
18
-
19
-
 20
20 -
 21
21 -
 22
22 -
 23
23 -
 24
24 -
 25
25 -
 26
26 -
 27
27 -
 28
28 -
 29
29 -
 30
30 -
 31
31 -
 32
32 -
 33
33 -
 34
34 -
 35
35 -
 36
36 -
 37
37 -
 38
38 -
 39
39 -
 40
40 -
41
-
42
-
43
-
44
-
45
-
46
-
47
-
48
-
49
-
50
-
51
-
52
-
53
-
54
-
55
-
56
-
57
-
58
-
59
-
60
-
61
-
62
-
63
-
64
-
65
-
66
-
67
-
68
-
69
-
70
-
71
-
72
 |
 |

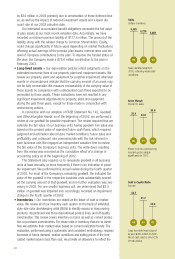
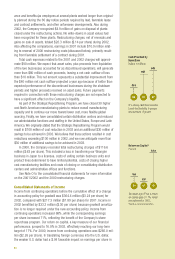
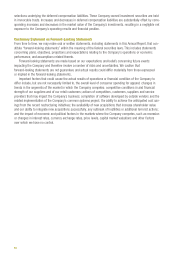
Sales
Dollars in millions
Sales declined slightly in
2002, reflecting weak retail
conditions.
5,403
00 01 02
5,220 5,084
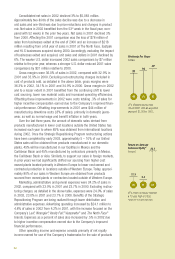
Debt to Capital Ratio
Percent
Long-term debt was reduced
by over $300 million in 2002.
Net of cash, debt is only 9.2%
of total capital.
34.7
00 01 02
31.7
28.6
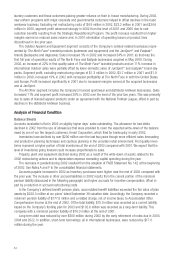
00 01 02
Gross Margin
Percent to sales
Moves to lower cost sourcing
boosted gross margins
significantly in 2002.
33.9 32.9
36.0
48
by $34 million in 2003 primarily due to amortization of these deferred loss-
es, as well as the impact of reduced investment assets and a lower dis-
count rate at our 2002 valuation date.
Our estimated accumulated benefit obligations exceeded the fair value
of plan assets at our most recent valuation date. Accordingly, we have
recorded a minimum pension liability of $177.6 million. The amount of the
liability, along with the related charge to Common Shareholders’ Equity,
could change significantly in future years depending on market fluctuations
affecting actual earnings of the pension plan assets, interest rates and the
level of Company contributions to the plan. To improve the funded status of
the plan, the Company made a $75.0 million contribution to the plan in
February 2003.
•Long-lived assets – Our depreciation policies reflect judgments on the
estimated economic lives of our property, plant and equipment assets. We
review our property, plant and equipment for possible impairment whenever
events or circumstances indicate that the carrying amount of an asset may
not be fully recoverable. We measure recoverability of the carrying value of
these assets by comparison with undiscounted cash flows expected to be
generated by those assets. These evaluations have not resulted in any
significant impairment adjustments to property, plant and equipment
during the past three years, except for those made in conjunction with
restructuring actions.
In connection with our adoption of FASB Statement No. 142, Goodwill
and Other Intangible Assets,as of the beginning of 2002, we performed a
review of our goodwill for possible impairment. The review required that we
estimate the fair value of our business units having goodwill. Fair value was
based on the present value of expected future cash flows, which required
judgment and estimation about future market conditions, future sales and
profitability, and a discount rate commensurate with the risk inherent in
each business unit. We engaged an independent valuation firm to review
the fair value of the Company’s business units. The write-down resulting
from this review was recorded as the cumulative effect of a change in
accounting policy as of the beginning of 2002.
This Statement also requires us to reevaluate goodwill in all business
units at least annually, or more frequently if there is an indication of possi-
ble impairment. We performed this annual review during the fourth quarter
of 2002. For most of the Company’s remaining goodwill, the indicated fair
value of the goodwill in the respective business units substantially exceed-
ed the carrying amount of that goodwill, and no further evaluation was nec-
essary in 2002. For one smaller business unit, we determined that $2.3
million of goodwill was impaired and, accordingly, recorded an impairment
charge in the fourth quarter of 2002.
•Inventories – Our inventories are stated at the lower of cost or market
value. We review all of our inventory each quarter on the basis of individual
style-size-color stockkeeping units (SKUs) to identify excess or slow moving
products, discontinued and to-be-discontinued product lines, and off-quality
merchandise. This review covers inventory on hand, as well as current produc-
tion or purchase commitments. For those units in inventory that are so identi-
fied, we estimate their market value based on current realization trends. The
evaluation, performed using a systematic and consistent methodology, requires
forecasts of future demand, market conditions and selling prices. If the fore-
casted market value is less than cost, we provide an allowance to reflect the