National Grid 2011 Annual Report Download - page 64
Download and view the complete annual report
Please find page 64 of the 2011 National Grid annual report below. You can navigate through the pages in the report by either clicking on the pages listed below, or by using the keyword search tool below to find specific information within the annual report.-
 1
1 -
2
-
3
-
4
-
5
-
6
-
7
-
8
-
9
-
10
-
11
-
12
-
13
-
14
-
15
-
16
-
17
-
18
-
19
-
20
-
21
-
22
-
23
-
24
-
25
-
26
-
27
-
28
-
29
-
30
-
31
-
32
-
33
-
34
-
35
-
36
-
37
-
38
-
39
-
40
-
41
-
42
-
43
-
44
-
45
-
46
-
47
-
48
-
49
-
50
-
51
-
52
-
53
-
 54
54 -
 55
55 -
 56
56 -
 57
57 -
 58
58 -
 59
59 -
 60
60 -
 61
61 -
 62
62 -
 63
63 -
 64
64 -
 65
65 -
 66
66 -
 67
67 -
 68
68 -
 69
69 -
 70
70 -
 71
71 -
 72
72 -
 73
73 -
 74
74 -
75
-
76
-
77
-
78
-
79
-
80
-
81
-
82
 |
 |

62 National Grid Gas plc Annual Report and Accounts 2010/11
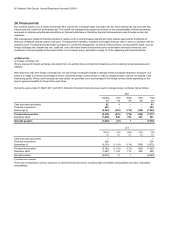
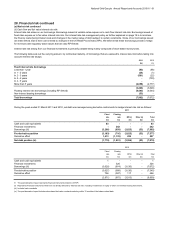
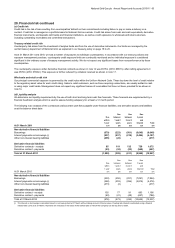
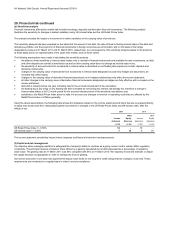
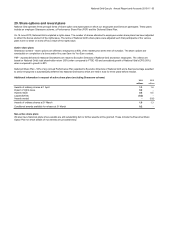
28. Financial risk continued
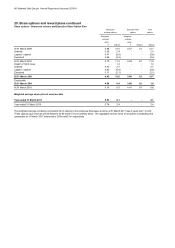
(b) Fair value analysis
Level 1 Level 2 Level 3 Total Level 1 Level 2 Level 3 Total
£m £m £m £m £m £m £m £m
Assets
A
vailable-for-sale investments 223 - - 223 307 - - 307
Derivative financial instruments - 614 1 615 - 635 2 637
223 614 1 838 307 635 2 944
Liabilities
Derivative financial instruments - (108) - (108) - (151) - (151)
Total 223 506 1 730 307 484 2 793
During the year no transfers have been made between the hierarchy levels.
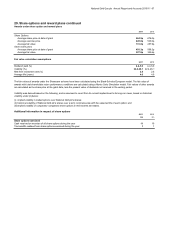
2011 2010
Level 3 Level 3
Valuation Valuation
£m £m
At 1 April 2 (1)
Net gains for the year (i) -3
Settlements (1) -
At 31 March 1 2
(i)
2010
The financial instruments classified as level 3 are currency swaps where the currency forward curve is illiquid. The changes in the value of our
level 3 derivative financial instruments are as follows:
Level 1: Financial instruments with quoted prices for identical instruments in active markets.
Level 2: Financial instruments with quoted prices for similar instruments in active markets or quoted prices for identical or similar instruments
in inactive markets and financial instruments valued using models where all significant inputs are based directly or indirectly on observable
market data.
Level 3: Financial instruments valued using techniques where one or more significant inputs are based on unobservable market data.
A reasonably possible change in assumptions is unlikely to result in a material change in the fair value of the level 3 instruments.
Gains are attributable to assets or liabilities held at the end of the reporting period and have been recognised in finance costs in the income statement
2011
The following is an analysis of our financial instruments measured at fair value. They are reported in a tiered hierarchy based on the valuation
methodology described on page 19, and reflecting the significance of market observable inputs. The best evidence of fair value is a quoted
price in an actively traded market. In the event that the market for a financial instrument is not active, a valuation technique is used.