National Grid 2011 Annual Report Download - page 54
Download and view the complete annual report
Please find page 54 of the 2011 National Grid annual report below. You can navigate through the pages in the report by either clicking on the pages listed below, or by using the keyword search tool below to find specific information within the annual report.-
 1
1 -
2
-
3
-
4
-
5
-
6
-
7
-
8
-
9
-
10
-
11
-
12
-
13
-
14
-
15
-
16
-
17
-
18
-
19
-
20
-
21
-
22
-
23
-
24
-
25
-
26
-
27
-
28
-
29
-
30
-
31
-
32
-
33
-
34
-
35
-
36
-
37
-
38
-
39
-
40
-
41
-
42
-
43
-
 44
44 -
 45
45 -
 46
46 -
 47
47 -
 48
48 -
 49
49 -
 50
50 -
 51
51 -
 52
52 -
 53
53 -
 54
54 -
 55
55 -
 56
56 -
 57
57 -
 58
58 -
 59
59 -
 60
60 -
 61
61 -
 62
62 -
 63
63 -
 64
64 -
65
-
66
-
67
-
68
-
69
-
70
-
71
-
72
-
73
-
74
-
75
-
76
-
77
-
78
-
79
-
80
-
81
-
82
 |
 |

52 National Grid Gas plc Annual Report and Accounts 2010/11
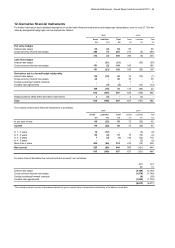
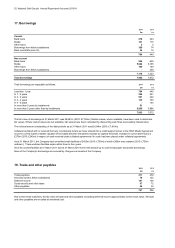
17. Borrowings
2011 2010
£m £m
Curren
t
Bank loans 278 243
Bonds 101 115
Other loans 22
Borrowings from fellow subsidiaries 369 74
Bank overdrafts (note 16) 34 15
784 449
Non-curren
t
Bank loans 994 659
Bonds 5,964 6,165
Other loans 160 149
Borrowings from fellow subsidiaries -250
7,118 7,223
Total borrowings 7,902 7,672
Total borrowings are repayable as follows:
2011 2010
£m £m
Less than 1 year 784 449
In 1 - 2 years 224 251
In 2 - 3 years 501 222
In 3 - 4 years 133 730
In 4 - 5 years -134
In more than 5 years by instalments 51 -
In more than 5 years other than by instalments 6,209 5,886
7,902 7,672
The notional amount outstanding of the debt portfolio as at 31 March 2011 was £8,048m (2010: £7,819m).
A
ll of the unused facilities at 31 March 2011 and at 31 March 2010 were held as back-up to commercial paper and similar borrowings.
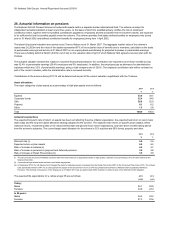
18. Trade and other payables
2011 2010
£m £m
Trade payables 411 439
A
mounts owed to fellow subsidiaries 78 125
Deferred income 147 136
Social security and other taxes 67 72
Other payables 44 34
747 806
The fair value of borrowings at 31 March 2011 was £8,081m (2010: £7,765m). Market values, where available, have been used to determine
fair values. Where market values are not available, fair values have been calculated by discounting cash flows at prevailing interest rates.
Due to their short maturities, the fair value of trade and other payables (excluding deferred income) approximates to their book value. All trade
and other payables are recorded at amortised cost.
Collateral is placed with or received from any counterparty where we have entered into a credit support annex to the ISDA Master Agreement
once the current mark-to-market valuation of the trades between the parties exceeds an agreed threshold. Included in current bank loans is
£275m (2010: £240m) in respect of cash received under collateral agreements. No cash has been placed under collateral agreements.
None of the Company's borrowings are secured by charges over assets of the Company.
As at 31 March 2011, the Company had committed credit facilities of £425m (2010: £700m) of which £425m was undrawn (2010: £700m
undrawn). These undrawn facilities expire within three to four years.