National Grid 2011 Annual Report Download - page 19
Download and view the complete annual report
Please find page 19 of the 2011 National Grid annual report below. You can navigate through the pages in the report by either clicking on the pages listed below, or by using the keyword search tool below to find specific information within the annual report.-
 1
1 -
2
-
3
-
4
-
5
-
6
-
7
-
8
-
 9
9 -
 10
10 -
 11
11 -
 12
12 -
 13
13 -
 14
14 -
 15
15 -
 16
16 -
 17
17 -
 18
18 -
 19
19 -
 20
20 -
 21
21 -
 22
22 -
 23
23 -
 24
24 -
 25
25 -
 26
26 -
 27
27 -
 28
28 -
 29
29 -
30
-
31
-
32
-
33
-
34
-
35
-
36
-
37
-
38
-
39
-
40
-
41
-
42
-
43
-
44
-
45
-
46
-
47
-
48
-
49
-
50
-
51
-
52
-
53
-
54
-
55
-
56
-
57
-
58
-
59
-
60
-
61
-
62
-
63
-
64
-
65
-
66
-
67
-
68
-
69
-
70
-
71
-
72
-
73
-
74
-
75
-
76
-
77
-
78
-
79
-
80
-
81
-
82
 |
 |

National Grid Gas plc Annual Report and Accounts 2010/11 17
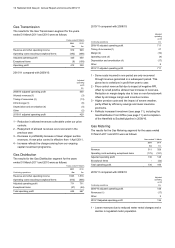
Cash flows
Cash flows from operating activities
Cash generated from continuing operations was £1,706 million
in 2010/11 compared with £1,872 million in 2009/10. This
included cash outflows relating to exceptional items of £72
million and £123 million respectively.
The net cash inflow from operating activities after taxation was
£1,588 million in 2010/11, compared with £1,563 million in
2009/10. This included a net corporate tax payment in 2010/11
of £118 million compared with £309 million in 2009/10.
Cash flows from investing activities
Cash outflows from investing activities were £919 million in
2010/11 compared with £266 million in 2009/10. Cash outflows
to purchase property, plant and equipment and intangible fixed
assets, net of disposal proceeds, were £1,005 million in
2010/11 compared with £952 million in 2009/10. Interest
received was £2 million in 2010/11 compared with £3 million in
2009/10. Net cash inflows from the disposal of financial
investments were £84 million in 2010/11 compared with £683
million in 2009/10.
Cash flows from financing activities
The net cash outflow from financing activities was £606 million
in 2010/11 compared with a cash outflow of £1,301 million in
2009/10. This reflected net inflows from loans of £58 million
(2009/10: £725 million outflow) and net payments to providers
of finance, in the form of interest and dividends, of £664 million
(2009/10: £576 million).
Net interest cash outflows decreased from £273 million in
2009/10 to £262 million in 2010/11.
Dividends paid to shareholders increased to £400 million in
2010/11 compared with £300 million in 2009/10.
Financial position and
financial management
Going concern
Having made enquiries, the Directors consider that the
Company and its subsidiaries have adequate resources to
continue in business for the foreseeable future and that it is
therefore appropriate to adopt the going concern basis in
preparing the consolidated and individual financial statements
of the Company. More details of our liquidity position are
provided under the heading Liquidity and treasury management
below and in note 28 to the consolidated financial statements.
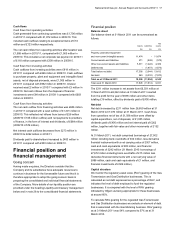
Financial position
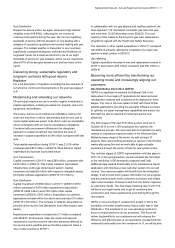
Balance sheet
Our balance sheet at 31 March 2011 can be summarised as
follows:
Assets Liabilities
Net
assets
£m £m £m
Property, plant and equipment
and non-current intangible assets 11,474 -11,474
Current assets and liabilities 271 (849) (578)
Other non-current assets and liabilities 5,611 (1,222) 4,389
Deferred tax - (1,873) (1,873)
Total before net debt 17,356 (3,944) 13,412
Net debt 940 (8,010) (7,070)
Total as at 31 March 2011 18,296 (11,954) 6,342
Total as at 31 March 2010 17,845 (11,814) 6,031
The £311 million increase in net assets from £6,031 million at
31 March 2010 to £6,342 million at 31 March 2011 resulted
from the profit for the year of £695 million and other items
totalling £16 million, offset by dividends paid of £400 million.
Net debt
Net debt increased by £211 million from £6,859 million at 31
March 2010 to £7,070 million at 31 March 2011. Cash flows
from operations net of tax of £1,588 million were offset by
capital expenditure, net of disposals, of £1,005 million,
dividends paid of £400 million and net interest paid of £262
million, together with fair value and other movements of £132
million.
At 31 March 2011, net debt comprised borrowings of £7,902
million including bank overdrafts of £34 million, less derivative
financial instruments with a net carrying value of £507 million,
cash and cash equivalents of £83 million, and financial
investments of £242 million (31 March 2010: borrowings of
£7,672 million including bank overdrafts of £15 million less
derivative financial instruments with a net carrying value of
£486 million, cash and cash equivalents of £1 million, and
financial investments of £326 million).
Capital structure
We monitor the regulatory asset value (RAV) gearing of the Gas
Transmission and Gas Distribution businesses. This is
calculated as net debt expressed as a percentage of RAV, and
indicates the level of debt employed to fund the regulated
businesses. It is compared with the level of RAV gearing
indicated by Ofgem as being appropriate for these businesses,
at around 60%.
To calculate RAV gearing for the regulated Gas Transmission
and Gas Distribution businesses we exclude an element of debt
that is associated with the Gas Metering business. RAV gearing
as at 31 March 2011 was 54% compared to 57% as at 31
March 2010.