National Grid 2011 Annual Report Download - page 10
Download and view the complete annual report
Please find page 10 of the 2011 National Grid annual report below. You can navigate through the pages in the report by either clicking on the pages listed below, or by using the keyword search tool below to find specific information within the annual report.-
 1
1 -
 2
2 -
 3
3 -
 4
4 -
 5
5 -
 6
6 -
 7
7 -
 8
8 -
 9
9 -
 10
10 -
 11
11 -
 12
12 -
 13
13 -
 14
14 -
 15
15 -
 16
16 -
 17
17 -
 18
18 -
 19
19 -
 20
20 -
 21
21 -
22
-
23
-
24
-
25
-
26
-
27
-
28
-
29
-
30
-
31
-
32
-
33
-
34
-
35
-
36
-
37
-
38
-
39
-
40
-
41
-
42
-
43
-
44
-
45
-
46
-
47
-
48
-
49
-
50
-
51
-
52
-
53
-
54
-
55
-
56
-
57
-
58
-
59
-
60
-
61
-
62
-
63
-
64
-
65
-
66
-
67
-
68
-
69
-
70
-
71
-
72
-
73
-
74
-
75
-
76
-
77
-
78
-
79
-
80
-
81
-
82
 |
 |

8 National Grid Gas plc Annual Report and Accounts 2010/11
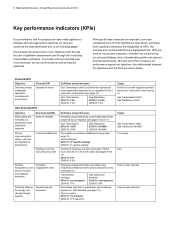
Key performance indicators (KPIs)
Our performance and the progress we have made against our
strategic aims and against the objectives we have set
ourselves are described below and on the following pages.
We measure the achievement of our objectives both through
the use of qualitative assessments and through the monitoring
of quantitative indicators. To provide a full and rounded view
of our business, we use non-financial as well as financial
measures.
Although all these measures are important, some are
considered to be of more significance than others, and these
more significant measures are designated as KPIs. Our
financial and non-financial KPIs are highlighted here. KPIs are
used as our primary measures of whether we are achieving
our principal strategic aims of sustainable growth and superior
financial performance. We also use KPIs to measure our
performance against our objectives; the relationships between
the objectives and the KPIs are shown below.
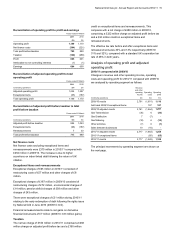
Financial KPI
Objective Financial KPI Definition and performance Target
Gas Transmission and Gas Distribution operational
return against the target set by our regulator for the 5
year price control period (see page 14)
Achieve or exceed regulatory allowed
return over 5 year price control period
of:
Delivering strong
sustainable
regulatory
contracts with
good returns
Operational return
Gas Transmission
2010/11: 7.2%
2009/10: 7.6%
Gas Distribution
2010/11: 5.54%
2009/10: 6.3%
Gas Transmission 5.05%
Gas Distribution 4.94%
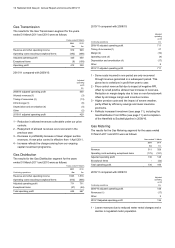
Non-financial KPIs
Objective Non-financial KPIs Definition and performance Target
Reliability of gas network as a percentage against the
target set by our regulator (see pages 10 and 11)
Modernising and
extending our
transmission and
distribution
networks
Network reliability
Gas Transmission
2010/11: 100%
2009/10: 100%
Gas Distribution
2010/11: 99.999%
2009/10: 99.999%
Gas Transmission 100%
Gas Distribution 99.999%
Customer satisfaction Our position in customer satisfaction surveys (see
page 10)
Gas Distribution
2010/11: 4th quartile ranking
2009/10: 4th quartile ranking
To improve
Driving
improvements in
safety, customer
and operational
performance
Employee lost time
injury frequency rate
Number of employee lost time injuries per 100,00
hours worked on a 12 month basis (see pages 9 and
10)
2010/11: 0.16
2009/10: 0.09
Zero
Employee engagement index calculated using
responses to National Grid’s annual employee survey
(see page 12)
Year-on-year increase
Building
transparency, trust
and an inclusive
and engaged
workforce
Employee
engagement index
Transmission
business:
2010/11: not measured
2009/10: 77%
Gas Distribution
business:
2010/11: not measured
2009/10: 68%
Positively shaping
the energy and
climate change
agenda
Greenhouse gas
emissions
Percentage reduction in greenhouse gas emissions
against our 1990 baseline (see page 13)
Year-on-year %
2010/11: 3% increase
2009/10: 17% reduction
Year-on-year reduction