National Grid 2011 Annual Report Download - page 41
Download and view the complete annual report
Please find page 41 of the 2011 National Grid annual report below. You can navigate through the pages in the report by either clicking on the pages listed below, or by using the keyword search tool below to find specific information within the annual report.-
 1
1 -
2
-
3
-
4
-
5
-
6
-
7
-
8
-
9
-
10
-
11
-
12
-
13
-
14
-
15
-
16
-
17
-
18
-
19
-
20
-
21
-
22
-
23
-
24
-
25
-
26
-
27
-
28
-
29
-
30
-
 31
31 -
 32
32 -
 33
33 -
 34
34 -
 35
35 -
 36
36 -
 37
37 -
 38
38 -
 39
39 -
 40
40 -
 41
41 -
 42
42 -
 43
43 -
 44
44 -
 45
45 -
 46
46 -
 47
47 -
 48
48 -
 49
49 -
 50
50 -
 51
51 -
52
-
53
-
54
-
55
-
56
-
57
-
58
-
59
-
60
-
61
-
62
-
63
-
64
-
65
-
66
-
67
-
68
-
69
-
70
-
71
-
72
-
73
-
74
-
75
-
76
-
77
-
78
-
79
-
80
-
81
-
82
 |
 |

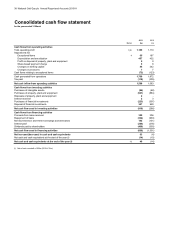
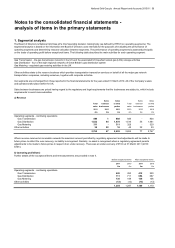
National Grid Gas plc Annual Report and Accounts 2010/11 39
Notes to the consolidated financial statements -
analysis of items in the primary statements
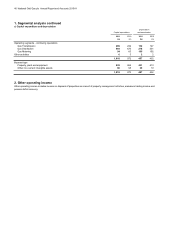
1. Segmental analysis
Gas Transmission - the gas transmission network in the UK and the associated UK liquefied natural gas (LNG) storage activities
Gas Distribution - four of the eight regional networks of Great Britain's gas distribution system
Gas Metering - regulated gas metering activities in the UK
a) Revenue
Sales Sales Sales Sales
Total between to third Total between to third
sales businesses parties sales businesses parties
2011 2011 2011 2010 2010 2010
£m £m £m £m £m £m
Operating segments - continuing operations
Gas Transmission 889 1 888 934 - 934
Gas Distribution 1,522 44 1,478 1,516 55 1,461
Gas Metering 311 - 311 329 - 329
Other activities 38 22 16 45 22 23
2,760 67 2,693 2,824 77 2,747
b) Operating profit/(loss)
Before exceptional items After exceptional items
2011 2010 2011 2010
£m £m £m £m
Operating segments - continuing operations
Gas Transmission 420 450 412 350
Gas Distribution 711 711 654 667
Gas Metering 136 148 136 106
Other activities (13) (12) (13) (13)
1,254 1,297 1,189 1,110
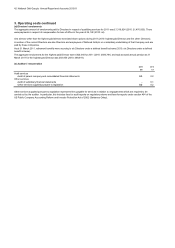
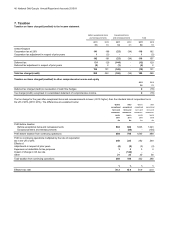
Where revenue received or receivable exceeds the maximum amount permitted by regulatory agreement and adjustments will be made to
future prices to reflect the over-recovery, no liablity is recognised. Similarly, no asset is recognised where a regulatory agreement permits
adjustments to be made to future prices in respect of an under-recovery. There was an under-recovery of £51m at 31 March 2011 (2010:
£50m).
Sales between businesses are priced having regard to the regulatory and legal requirements that the businesses are subject to, which include
requirements to avoid cross-subsidies.
Our segments are unchanged from those reported in the financial statements for the year ended 31 March 2010. All of the Company's sales
and operations take place within the UK.
Further details of the exceptional items and remeasurements are provided in note 4.
Other activities relate to the xoserve business which provides transportation transaction services on behalf of all the major gas network
transportation companies, including ourselves, together with corporate activities.
The Board of Directors is National Grid Gas plc's chief operating decision making body (as defined by IFRS 8 on operating segments). The
segmental analysis is based on the information the Board of Directors uses internally for the purposes of evaluating the performance of
operating segments and determining resource allocation between segments. The performance of operating segments is assessed principally
on the basis of operating profit before exceptional items. The following table describes the main activities for each operating segment: