National Grid 2011 Annual Report Download - page 42
Download and view the complete annual report
Please find page 42 of the 2011 National Grid annual report below. You can navigate through the pages in the report by either clicking on the pages listed below, or by using the keyword search tool below to find specific information within the annual report.-
 1
1 -
2
-
3
-
4
-
5
-
6
-
7
-
8
-
9
-
10
-
11
-
12
-
13
-
14
-
15
-
16
-
17
-
18
-
19
-
20
-
21
-
22
-
23
-
24
-
25
-
26
-
27
-
28
-
29
-
30
-
31
-
 32
32 -
 33
33 -
 34
34 -
 35
35 -
 36
36 -
 37
37 -
 38
38 -
 39
39 -
 40
40 -
 41
41 -
 42
42 -
 43
43 -
 44
44 -
 45
45 -
 46
46 -
 47
47 -
 48
48 -
 49
49 -
 50
50 -
 51
51 -
 52
52 -
53
-
54
-
55
-
56
-
57
-
58
-
59
-
60
-
61
-
62
-
63
-
64
-
65
-
66
-
67
-
68
-
69
-
70
-
71
-
72
-
73
-
74
-
75
-
76
-
77
-
78
-
79
-
80
-
81
-
82
 |
 |

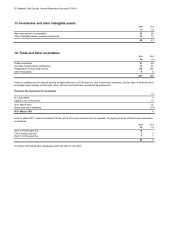
40 National Grid Gas plc Annual Report and Accounts 2010/11
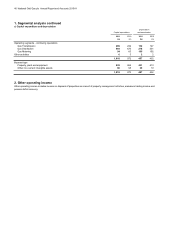
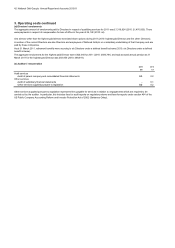
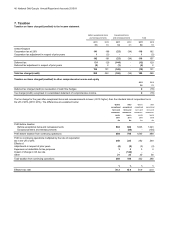
1. Segmental analysis continued
c) Capital expenditure and depreciation
Depreciation
Capital expenditure and amortisation
2011 2010 2011 2010
£m £m £m £m
Operating segments - continuing operations
Gas Transmission 289 232 132 127
Gas Distribution 669 670 218 201
Gas Metering 54 65 105 102
Other activities 6522
1,018 972 457 432
By asset type
Property, plant and equipment 932 904 431 413
Other non-current intangible assets 86 68 26 19
1,018 972 457 432
2. Other operating income
Other operating income includes income on disposal of properties as a result of property management activities, emissions trading income and
pension deficit recovery.