NVIDIA 2004 Annual Report Download - page 52
Download and view the complete annual report
Please find page 52 of the 2004 NVIDIA annual report below. You can navigate through the pages in the report by either clicking on the pages listed below, or by using the keyword search tool below to find specific information within the annual report.-
 1
1 -
2
-
3
-
4
-
5
-
6
-
7
-
8
-
9
-
10
-
11
-
12
-
13
-
14
-
15
-
16
-
17
-
18
-
19
-
20
-
21
-
22
-
23
-
24
-
25
-
26
-
27
-
28
-
29
-
30
-
31
-
32
-
33
-
34
-
35
-
36
-
37
-
38
-
39
-
40
-
41
-
 42
42 -
 43
43 -
 44
44 -
 45
45 -
 46
46 -
 47
47 -
 48
48 -
 49
49 -
 50
50 -
 51
51 -
 52
52 -
 53
53 -
 54
54 -
 55
55 -
 56
56 -
 57
57 -
 58
58 -
 59
59 -
 60
60 -
 61
61 -
 62
62 -
63
-
64
-
65
-
66
-
67
-
68
-
69
 |
 |

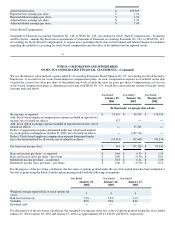
15%. The price of common stock purchased under the Purchase Plan will be equal to the lower of the fair market value of the common
stock on the commencement date of each offering period and the purchase date of each offering period at 85% at the fair market value
of the common stock on the relevant purchase date. Employees may end their participation in the offering at any time during the
offering period, and participation ends automatically on termination of employment with us and in each case their contributions are
refunded.
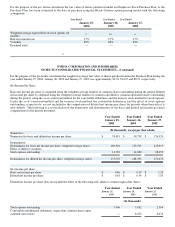
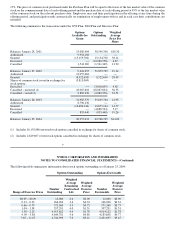
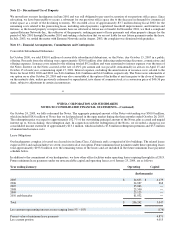
The following summarizes the transactions under the 1998 Plan, 2000 Plan and Directors Plan:
Options
Available for
Grant
Options
Outstanding Weighted
Average
Price Per
Share
Balances, January 28, 2001 13,080,404 50,549,356 $10.30
Authorized 9,954,182 −− −−
Granted (15,159,700) 15,154,700 38.14
Exercised −− (12,282,958) 6.87
Cancelled 1,541,369 (1,541,369) 13.90
Balances, January 27, 2002 9,416,255 51,879,729 19.14
Authorized 13,957,063 −− −−
Granted (8,522,650) 8,522,650 28.09
Shares of common stock issued in exchange for
stock options (3,815,069) −− −−
Exercised −− (3,816,695) 4.62
Cancelled − unvested (1) 18,067,604 (18,067,604) 36.53
Cancelled – vested (2) 2,882,376 (2,882,376) 32.51
Balances, January 26, 2003 31,985,579 35,635,704 12.93
Authorized 8,796,156 −− −−
Granted (12,680,144) 12,675,144 14.77
Exercised −− (4,688,703) 5.17
Cancelled 855,440 (855,440) 19.26
Balances, January 25, 2004 28,957,031 42,766,705 $14.20
(1) Includes 16,193,886 unvested stock options cancelled in exchange for shares of common stock.
(2) Includes 2,649,607 vested stock options cancelled in exchange for shares of common stock.
57
NVIDIA CORPORATION AND SUBSIDIARIES
NOTES TO CONSOLIDATED FINANCIAL STATEMENTS – (Continued)
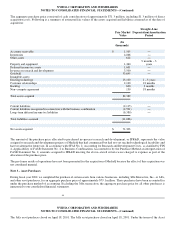
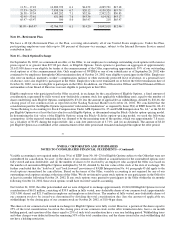
The following table summarizes information about stock options outstanding as of January 25, 2004:
Options Outstanding Options Exercisable
Range of Exercise Prices Number
Outstanding
Weighted
Average
Remaining
Contractual
Life
Weighted
Average
Exercise
Price Number
Exercisable
Weighted
Average
Exercise
Price
$0.09 − $0.09 12,000 2.6 $0.09 12,000 $0.09
0.33 – 0.33 166,900 3.6 $0.33 166,900 $0.33
0.66 – 0.79 571,360 3.9 $0.75 571,360 $0.75
1.04 – 1.38 357,291 4.0 $1.31 357,291 $1.31
1.58 – 2.25 4,915,622 4.4 $1.78 4,914,122 $1.78
4 .09 – 5.88 4,644,781 5.6 $4.80 4,185,698 $4.77
7.65 – 11.07 4,744,990 7.0 $9.41 2,431,695 $9.45