NVIDIA 2004 Annual Report Download - page 36
Download and view the complete annual report
Please find page 36 of the 2004 NVIDIA annual report below. You can navigate through the pages in the report by either clicking on the pages listed below, or by using the keyword search tool below to find specific information within the annual report.-
 1
1 -
2
-
3
-
4
-
5
-
6
-
7
-
8
-
9
-
10
-
11
-
12
-
13
-
14
-
15
-
16
-
17
-
18
-
19
-
20
-
21
-
22
-
23
-
24
-
25
-
 26
26 -
 27
27 -
 28
28 -
 29
29 -
 30
30 -
 31
31 -
 32
32 -
 33
33 -
 34
34 -
 35
35 -
 36
36 -
 37
37 -
 38
38 -
 39
39 -
 40
40 -
 41
41 -
 42
42 -
 43
43 -
 44
44 -
 45
45 -
 46
46 -
47
-
48
-
49
-
50
-
51
-
52
-
53
-
54
-
55
-
56
-
57
-
58
-
59
-
60
-
61
-
62
-
63
-
64
-
65
-
66
-
67
-
68
-
69
 |
 |

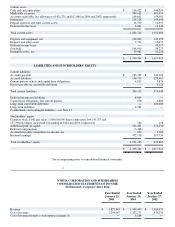
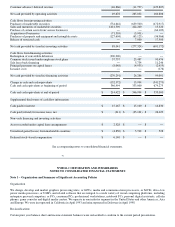
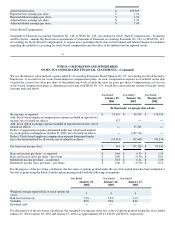
Gross profit 528,878 576,012 519,238
Operating expenses:
Research and development 269,972 224,873 154,752
Sales, general and administrative 165,249 151,485 98,944
In−process research and development 3,500 −− −−
Stock option exchange (1) −− 55,668 −−
Amortization of goodwill −− −− 10,093
Acquisition related charges −− −− 10,030
Discontinued use of property −− −− 3,687
Total operating expenses 438,721 432,026 277,506
Income from operations 90,157 143,986 241,732
Interest income 18,561 23,246 27,713
Interest expense (12,010) (16,467) (16,173)
Other income (expense), net 3,033 (208) (523)
Convertible debenture redemption expense (13,068) −− −−
Income before income tax expense 86,673 150,557 252,749
Income tax expense 12,254 59,758 75,825
Net income $ 74,419 $ 90,799 $ 176,924
Basic net income per share $ 0.46 $ 0.59 $ 1.24
Diluted net income per share $ 0.43 $ 0.54 $ 1.03
Shares used in basic per share computation 160,924 153,513 143,015
Shares used in diluted per share computation 172,707 168,393 171,074
___________________________________________________________________________________________
(1) The $61,832 stock option exchange expense for the year ended January 26, 2003, relates to personnel associated with cost of
revenue (for manufacturing personnel), research and development, and sales, general and administrative of $6,164, $35,417 and
$20,251, respectively.
See accompanying notes to consolidated financial statements.
40
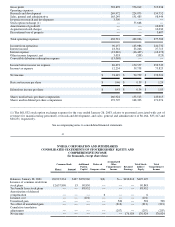
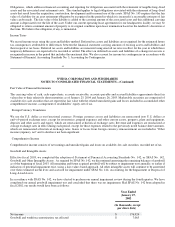
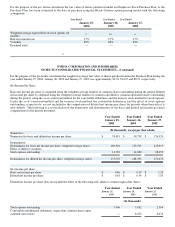
NVIDIA CORPORATION AND SUBSIDIARIES
CONSOLIDATED STATEMENTS OF STOCKHOLDERS’ EQUITY AND
COMPREHENSIVE INCOME
(In thousands, except share data)
Common Stock Additional Deferred Accumulated
Other Total Stock− Total
Shares Amount Paid in
Capital Compens−ation Comprehensive
Income Retained
Earnings holders’
Equity Comprehensive
Income
Balances, January 28, 2001 136,915,234 $137 $276,960 $(6) $−− $130,016 $407,107
Issuance of common stock from
stock plans 12,637,896 13 90,830 −− −− −− 90,843
Tax benefit from stock plans −− −− 88,932 −− −− −− 88,932
Amortization of deferred
compensation −− −− −− 6 −− −− 6
Issuance cost −− −− (101) −− −− −− (101)
Unrealized gain −− −− −− −− 528 −− 528 528
Tax effect of unrealized gain −− −− −− −− (213) −− (213) (213)
Cumulative translation
adjustments −− −− −− −− (207) −− (207) (207)
Net income −− −− −− −− −− 176,924 176,924 176,924