NVIDIA 2004 Annual Report Download - page 48
Download and view the complete annual report
Please find page 48 of the 2004 NVIDIA annual report below. You can navigate through the pages in the report by either clicking on the pages listed below, or by using the keyword search tool below to find specific information within the annual report.-
 1
1 -
2
-
3
-
4
-
5
-
6
-
7
-
8
-
9
-
10
-
11
-
12
-
13
-
14
-
15
-
16
-
17
-
18
-
19
-
20
-
21
-
22
-
23
-
24
-
25
-
26
-
27
-
28
-
29
-
30
-
31
-
32
-
33
-
34
-
35
-
36
-
37
-
 38
38 -
 39
39 -
 40
40 -
 41
41 -
 42
42 -
 43
43 -
 44
44 -
 45
45 -
 46
46 -
 47
47 -
 48
48 -
 49
49 -
 50
50 -
 51
51 -
 52
52 -
 53
53 -
 54
54 -
 55
55 -
 56
56 -
 57
57 -
 58
58 -
59
-
60
-
61
-
62
-
63
-
64
-
65
-
66
-
67
-
68
-
69
 |
 |

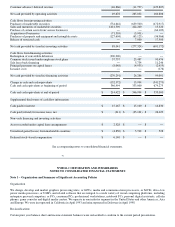
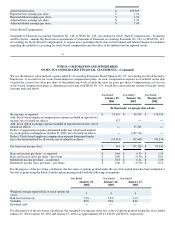
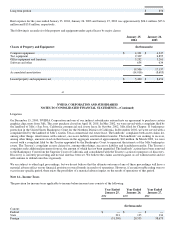
impairments relative to the underlying portfolio and concluded that such amounts were not
"other−than−temporary" as defined by SFAS No. 115, Accounting for Certain Investments in Debt
and Equity Securities .
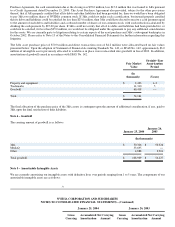
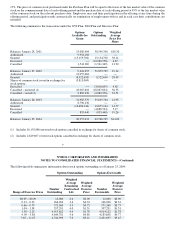
January 26, 2003
Amortized
Cost Unrealized
Gain Unrealized
(Loss) Estimated
Fair Value
(In thousands)
Asset−backed securities $ 92,286 $ 535 $ (635) $ 92,186
Commercial paper 109,465 −− −− 109,465
Obligations of the U.S. government & its agencies 359,003 2,847 (11) 361,839
U.S. corporate notes, bonds, and obligations 262,914 3,551 (21) 266,444
Money market 192,754 −− −− 192,754
Total $ 1,016,422 $ 6,933 $ (667) $ 1,022,688
Classified as:
Cash equivalents $ 341,269
Marketable securities 681,419
Total $ 1,022,688
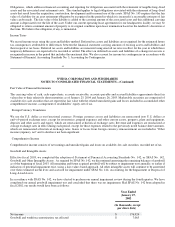
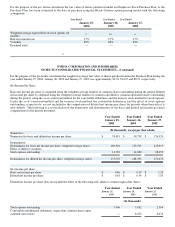
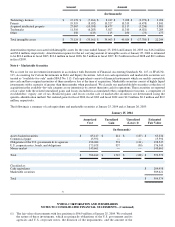
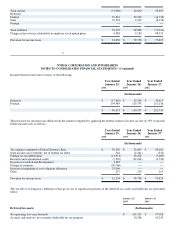
The amortized cost and estimated fair value of cash equivalents and marketable securities classified as available−for−sale at January
25, 2004 and at January 26, 2003 by expected maturity are shown below.
January 25, 2004 January 26, 2003
Amortized
Cost Estimated
Fair Value Amortized
Cost Estimated
Fair Value
(In thousands)
Less than one year $ 282,762 $ 283,123 $ 592,025 $ 593,714
Due in 1 – 5 years 315,400 316,456 424,397 428,974
Total $ 598,162 $ 599,579 $ 1,016,422 $ 1,022,688
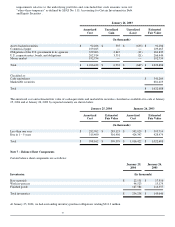
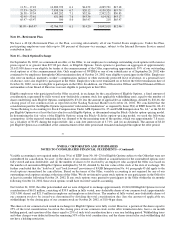
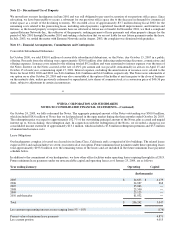
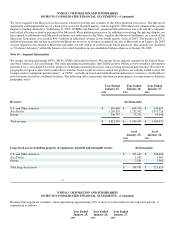
Note 7 − Balance Sheet Components
Certain balance sheet components are as follows:
January 25, January 26,
2004 2003
Inventories: (In thousands)
Raw materials $ 22,131 $ 17,510
Work in−process 44,523 13,179
Finished goods 167,584 114,357
Total inventories $ 234,238 $ 145,046
At January 25, 2004, we had outstanding inventory purchase obligations totaling $213.3 million.
53