Memorex 2013 Annual Report Download - page 96
Download and view the complete annual report
Please find page 96 of the 2013 Memorex annual report below. You can navigate through the pages in the report by either clicking on the pages listed below, or by using the keyword search tool below to find specific information within the annual report.-
 1
1 -
2
-
3
-
4
-
5
-
6
-
7
-
8
-
9
-
10
-
11
-
12
-
13
-
14
-
15
-
16
-
17
-
18
-
19
-
20
-
21
-
22
-
23
-
24
-
25
-
26
-
27
-
28
-
29
-
30
-
31
-
32
-
33
-
34
-
35
-
36
-
37
-
38
-
39
-
40
-
41
-
42
-
43
-
44
-
45
-
46
-
47
-
48
-
49
-
50
-
51
-
52
-
53
-
54
-
55
-
56
-
57
-
58
-
59
-
60
-
61
-
62
-
63
-
64
-
65
-
66
-
67
-
68
-
69
-
70
-
71
-
72
-
73
-
74
-
75
-
76
-
77
-
78
-
79
-
80
-
81
-
82
-
83
-
84
-
85
-
 86
86 -
 87
87 -
 88
88 -
 89
89 -
 90
90 -
 91
91 -
 92
92 -
 93
93 -
 94
94 -
 95
95 -
 96
96 -
 97
97 -
 98
98 -
 99
99 -
 100
100 -
 101
101 -
 102
102 -
 103
103 -
 104
104 -
 105
105 -
 106
106 -
107
-
108
-
109
-
110
-
111
-
112
-
113
-
114
-
115
-
116
-
117
-
118
-
119
-
120
-
121
-
122
 |
 |

NOTES TO CONSOLIDATED FINANCIAL STATEMENTS — (Continued)
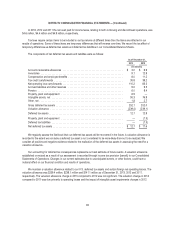
We have not provided specific asset information by segment, as it is not provided to our chief operating decision maker
for review at a segment specific level. Corporate and unallocated amounts above include non-cash goodwill impairment
charges of $23.3 million and $1.6 million for the years ended December 31, 2012, 2011, respectively, non-cash intangible
asset impairment charges of $251.8 million for the year ended December 31, 2012, restructuring and other costs of
$11.3 million, $21.1 million and $21.5 million for the years ended December 31, 2013, 2012 and 2011, respectively and
litigation settlement gains of $2.5 million for the year ended December 31, 2013 and litigation settlement charges of
$2.0 million for the year ended December 31, 2011.
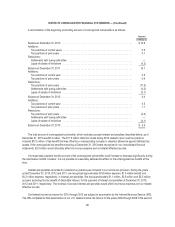
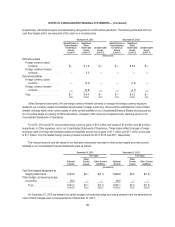
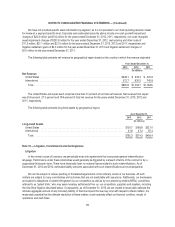
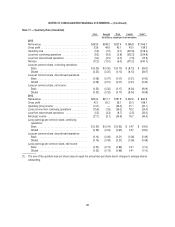
The following table presents net revenue by geographical region based on the country in which the revenue originated:
Years Ended December 31,
2013 2012 2011
(In millions)
Net Revenue
United States ......................................................... $348.1 $ 376.2 $ 420.8
International .......................................................... 512.7 630.5 745.8
Total .............................................................. $860.8 $1,006.7 $1,166.6
The United States and Japan each comprise more than 10 percent of our total net revenue. Net revenue from Japan
was 20.6 percent, 21.0 percent and 19.4 percent of total net revenue for the years ended December 31, 2013, 2012 and
2011, respectively.
The following table presents long-lived assets by geographical region:
As of December 31,
2013 2012 2011
(In millions)
Long-Lived Assets
United States ............................................................ $150.7 $166.9 $321.0
International ............................................................. 41.6 47.4 87.4
Total ................................................................. $192.3 $214.3 $408.4
Note 15 — Litigation, Commitments and Contingencies
Litigation
In the normal course of business, we periodically enter into agreements that incorporate general indemnification
language. Performance under these indemnities would generally be triggered by a breach of terms of the contract or by a
supportable third-party claim. There have historically been no material losses related to such indemnifications. As of
December 31, 2013 and 2012, estimated liability amounts associated with such indemnifications are inconsequential.
We are the subject of various pending or threatened legal actions in the ordinary course of our business. All such
matters are subject to many uncertainties and outcomes that are not predictable with assurance. Additionally, our businesses
are subject to allegations of patent infringement by our competitors as well as by non-practicing entities (NPEs), sometimes
referred to as “patent trolls,” who may seek monetary settlements from us, our competitors, suppliers and resellers, including
the One-Blue litigation described below. Consequently, as of December 31, 2013, we are unable to reasonably estimate the
ultimate aggregate amount of any monetary liability or financial impact that we may incur with respect to these matters. It is
reasonably possible that the ultimate resolution of these matters could materially affect our financial condition, results of
operations and cash flows.
93