Memorex 2013 Annual Report Download - page 70
Download and view the complete annual report
Please find page 70 of the 2013 Memorex annual report below. You can navigate through the pages in the report by either clicking on the pages listed below, or by using the keyword search tool below to find specific information within the annual report.-
 1
1 -
2
-
3
-
4
-
5
-
6
-
7
-
8
-
9
-
10
-
11
-
12
-
13
-
14
-
15
-
16
-
17
-
18
-
19
-
20
-
21
-
22
-
23
-
24
-
25
-
26
-
27
-
28
-
29
-
30
-
31
-
32
-
33
-
34
-
35
-
36
-
37
-
38
-
39
-
40
-
41
-
42
-
43
-
44
-
45
-
46
-
47
-
48
-
49
-
50
-
51
-
52
-
53
-
54
-
55
-
56
-
57
-
58
-
59
-
 60
60 -
 61
61 -
 62
62 -
 63
63 -
 64
64 -
 65
65 -
 66
66 -
 67
67 -
 68
68 -
 69
69 -
 70
70 -
 71
71 -
 72
72 -
 73
73 -
 74
74 -
 75
75 -
 76
76 -
 77
77 -
 78
78 -
 79
79 -
 80
80 -
81
-
82
-
83
-
84
-
85
-
86
-
87
-
88
-
89
-
90
-
91
-
92
-
93
-
94
-
95
-
96
-
97
-
98
-
99
-
100
-
101
-
102
-
103
-
104
-
105
-
106
-
107
-
108
-
109
-
110
-
111
-
112
-
113
-
114
-
115
-
116
-
117
-
118
-
119
-
120
-
121
-
122
 |
 |

NOTES TO CONSOLIDATED FINANCIAL STATEMENTS — (Continued)
Also during 2012, we accelerated the amortization of several intangible assets due to certain business decisions to
abandon the intangible assets during year. The total charge for the accelerated amortization of these intangible assets was
$1.9 million which was recorded in restructuring and other in our Consolidated Statements of Operations.
As of December 31, 2013, we had $66.9 million of definite-lived intangible assets subject to amortization and
$1.7 million of indefinite-lived intangible assets not subject to amortization. While we believe that the current carrying value of
these assets is recoverable, different assumptions regarding future performance of our businesses could result in significant
impairment losses.
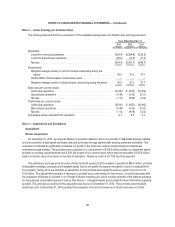
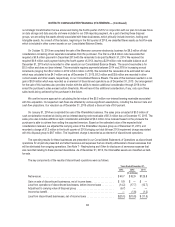
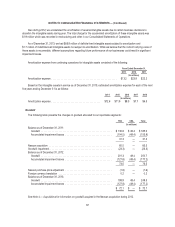
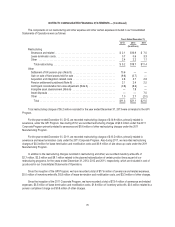
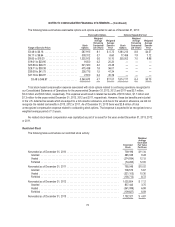
Amortization expense from continuing operations for intangible assets consisted of the following:
Years Ended December 31,
2013 2012 2011
(In millions)
Amortization expense ................................................ $13.2 $23.9 $22.2
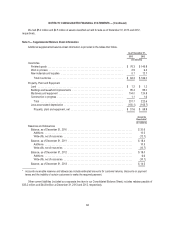
Based on the intangible assets in service as of December 31, 2013, estimated amortization expense for each of the next
five years ending December 31 is as follows:
2014 2015 2016 2017 2018
(In millions)
Amortization expense .................................... $12.6 $11.9 $8.5 $7.7 $6.3
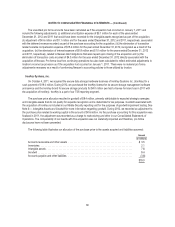
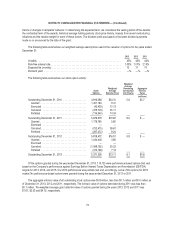
Goodwill
The following table presents the changes in goodwill allocated to our reportable segments:
TSS CSA Total
(In millions)
Balance as of December 31, 2011:
Goodwill .................................................... $135.8 $ 49.4 $ 185.2
Accumulated impairment losses .................................. (104.5) (49.4) (153.9)
31.3 — 31.3
Nexsan acquisition .............................................. 65.5 — 65.5
Goodwill impairment ............................................. (23.3) — (23.3)
Balance as of December 31, 2012:
Goodwill .................................................... 201.3 49.4 250.7
Accumulated impairment losses .................................. (127.8) (49.4) (177.2)
73.5 — 73.5
Nexsan purchase price adjustment .................................. (1.6) — (1.6)
Foreign currency translation ....................................... 0.2 — 0.2
Balance as of December 31, 2013:
Goodwill .................................................... 199.9 49.4 249.3
Accumulated impairment losses .................................. (127.8) (49.4) (177.2)
$ 72.1 $ — $ 72.1
See Note 4 — Acquisitions for information on goodwill acquired in the Nexsan acquisition during 2012.
67