Memorex 2013 Annual Report Download - page 22
Download and view the complete annual report
Please find page 22 of the 2013 Memorex annual report below. You can navigate through the pages in the report by either clicking on the pages listed below, or by using the keyword search tool below to find specific information within the annual report.-
 1
1 -
2
-
3
-
4
-
5
-
6
-
7
-
8
-
9
-
10
-
11
-
 12
12 -
 13
13 -
 14
14 -
 15
15 -
 16
16 -
 17
17 -
 18
18 -
 19
19 -
 20
20 -
 21
21 -
 22
22 -
 23
23 -
 24
24 -
 25
25 -
 26
26 -
 27
27 -
 28
28 -
 29
29 -
 30
30 -
 31
31 -
 32
32 -
33
-
34
-
35
-
36
-
37
-
38
-
39
-
40
-
41
-
42
-
43
-
44
-
45
-
46
-
47
-
48
-
49
-
50
-
51
-
52
-
53
-
54
-
55
-
56
-
57
-
58
-
59
-
60
-
61
-
62
-
63
-
64
-
65
-
66
-
67
-
68
-
69
-
70
-
71
-
72
-
73
-
74
-
75
-
76
-
77
-
78
-
79
-
80
-
81
-
82
-
83
-
84
-
85
-
86
-
87
-
88
-
89
-
90
-
91
-
92
-
93
-
94
-
95
-
96
-
97
-
98
-
99
-
100
-
101
-
102
-
103
-
104
-
105
-
106
-
107
-
108
-
109
-
110
-
111
-
112
-
113
-
114
-
115
-
116
-
117
-
118
-
119
-
120
-
121
-
122
 |
 |

PART II
Item 5. Market for Registrant’s Common Equity, Related Stockholder Matters and Issuer Purchases of Equity
Securities.
(a) — (b)
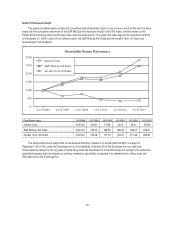
As of March 6, 2014, there were 41,993,542 shares of our common stock, $0.01 par value (common stock), outstanding
and held by 19,369 shareholders of record. Our common stock is listed on the New York Stock Exchange and the Chicago
Stock Exchange under the symbol “IMN.” No dividends were declared or paid during 2013 or 2012. Future dividend payments
will depend on our earnings, capital requirements, financial condition limitations as defined in our credit agreements and other
factors considered relevant by our Board of Directors.
Unregistered Sales of Equity Securities
The following table sets forth, for the periods indicated, the high and low sales prices of common stock as reported on
the New York Stock Exchange.
2013 Sales Prices 2012 Sales Prices
High Low High Low
First quarter ...................................... $4.24 $3.41 $6.42 $5.67
Second quarter .................................... $4.40 $3.56 $6.30 $5.54
Third quarter ...................................... $5.05 $3.99 $5.98 $5.40
Fourth quarter .................................... $4.85 $3.95 $5.69 $3.95
(c)
Issuer Purchases of Equity Securities
Period
(a)
Total Number
of Shares
Purchased
(b)
Average
Price Paid
per Share
Total Number of
Shares Purchased
as Part of Publicly
Announced Plans
or Programs
(c)
Maximum Number
of Shares that May
Yet Be Purchased
Under the Plan or
Programs
October 1, 2013—October 31, 2013 ................... — $ — — 3,147,258
November 1, 2013—November 30, 2013 ................ 917 4.19 — 3,147,258
December 1, 2013—December 31, 2013 ................ 2,282 4.68 — 3,147,258
Total ........................................... 3,199 $4.54 — 3,147,258
(a) The purchases in this column were shares that were surrendered to Imation by participants in our stock-based
compensation plans (the Plans) to satisfy the tax obligations related to the vesting of restricted stock awards.
(b) The average price paid in this column related to shares that were surrendered to Imation by participants in the Plans to
satisfy the tax obligations related to the vesting of restricted stock awards.
(c) On May 3, 2012, the Company announced that on May 2, 2012 our Board of Directors authorized a share repurchase
program of 5 million shares of common stock. The authorization has no expiration date.
19