Memorex 2013 Annual Report Download - page 29
Download and view the complete annual report
Please find page 29 of the 2013 Memorex annual report below. You can navigate through the pages in the report by either clicking on the pages listed below, or by using the keyword search tool below to find specific information within the annual report.-
 1
1 -
2
-
3
-
4
-
5
-
6
-
7
-
8
-
9
-
10
-
11
-
12
-
13
-
14
-
15
-
16
-
17
-
18
-
 19
19 -
 20
20 -
 21
21 -
 22
22 -
 23
23 -
 24
24 -
 25
25 -
 26
26 -
 27
27 -
 28
28 -
 29
29 -
 30
30 -
 31
31 -
 32
32 -
 33
33 -
 34
34 -
 35
35 -
 36
36 -
 37
37 -
 38
38 -
 39
39 -
40
-
41
-
42
-
43
-
44
-
45
-
46
-
47
-
48
-
49
-
50
-
51
-
52
-
53
-
54
-
55
-
56
-
57
-
58
-
59
-
60
-
61
-
62
-
63
-
64
-
65
-
66
-
67
-
68
-
69
-
70
-
71
-
72
-
73
-
74
-
75
-
76
-
77
-
78
-
79
-
80
-
81
-
82
-
83
-
84
-
85
-
86
-
87
-
88
-
89
-
90
-
91
-
92
-
93
-
94
-
95
-
96
-
97
-
98
-
99
-
100
-
101
-
102
-
103
-
104
-
105
-
106
-
107
-
108
-
109
-
110
-
111
-
112
-
113
-
114
-
115
-
116
-
117
-
118
-
119
-
120
-
121
-
122
 |
 |

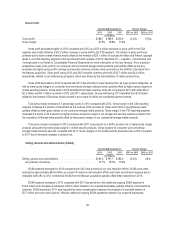
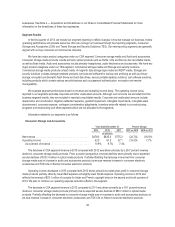
Gross Profit
Years Ended December 31, Percent Change
2013 2012 2011 2013 vs. 2012 2012 vs. 2011
(In millions)
Gross profit .......................................... $188.7 $189.3 $205.4 (0.3)% (7.8)%
Gross margin ......................................... 21.9% 18.8% 17.6%
Gross profit decreased slightly in 2013 compared with 2012 as a $12.4 million decrease in gross profit in the CSA
segment was mostly offset by a $12.2 million increase in gross profit in the TSS segment. The decline in gross profit was
primarily due to lower overall revenue mostly offset by the reversal of $23.1 million of accruals for Italian and French copyright
levies in our CSA reporting segment in the second and fourth quarters of 2013. See Note 15 — Litigation, Commitments and
Contingencies in our Notes to Consolidated Financial Statements for more information on the levy reversal. From a product
perspective, lower gross profit in our consumer and commercial storage media products was partially offset by the levy
reversals and higher gross profit in storage and security solutions products driven primarily by the addition of products from
the Nexsan acquisition. Gross profit during 2013 and 2012 included inventory write-offs of $2.7 million and $2.3 million,
respectively, related to our restructuring programs, which was driven by the rationalization of certain product lines.
Gross profit decreased in 2012 compared with 2011 due primarily to lower revenue from all major product categories, as
well as lower gross margins on consumer and commercial storage media products, partially offset by higher gross margins on
mobile security products. Gross profit in 2012 benefited from lower inventory write-offs compared to 2011 with write-offs of
$2.3 million and $9.1 million recorded in 2012 and 2011, respectively. Gross profit during 2011 benefited from $7.8 million
related to the reversal of European levies accrued in prior years for which we considered payment remote.
Total gross margin increased 3.1 percentage points in 2013 compared with 2012. Gross margin in the CSA reporting
segment increased 4.0 points to 23.8 percent as the reversal of the accruals for Italian and French copyright levies were
partially offset by lower gross margin on our consumer storage media products. Gross margin in the TSS reporting segment
increased 2.6 points to 20.3 percent as higher revenue and gross margin in our storage and security solutions products from
the acquisition of Nexsan were partially offset by lower gross margin on our commercial storage media products.
Total gross margins increased in 2012 compared with 2011 due primarily to a shift in product mix to higher gross margin
products along with improved gross margins in mobile security products. Gross margins for consumer and commercial
storage media products were flat compared with 2011. Gross margins in our mobile security products rose in 2012 compared
to 2011 due to favorable changes in product mix.
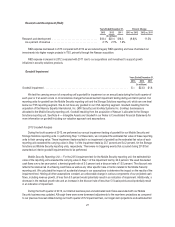
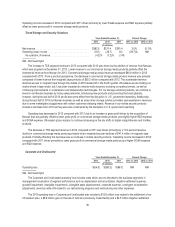
Selling, General and Administrative (SG&A)
Years Ended December 31, Percent Change
2013 2012 2011 2013 vs. 2012 2012 vs. 2011
(In millions)
Selling, general and administrative ......................... $181.6 $191.1 $182.4 (5.0)% 4.8%
As a percent of revenue ............................... 21.1% 19.0% 15.6%
SG&A expense decreased in 2013 compared with 2012 due primarily to our cost reduction efforts. SG&A costs were
reduced by approximately $44.6 million as a result of Imation’s cost reduction efforts and lower amortization expense due to
intangible write-offs in 2012. Incremental SG&A from the Nexsan acquisition partially offset these reductions in 2013.
SG&A expense increased in 2012 compared with 2011 due primarily to the additional ongoing SG&A expense of
$12.2 million and intangible amortization of $2.3 million related to our acquired businesses partially offset by cost reductions
achieved. SG&A expense in 2011 was impacted by lower compensation expense, the reversal of a bad debt reserve of
$2.7 million and cost control actions, offset by additional ongoing SG&A expenses related to our acquired businesses.
26