Memorex 2013 Annual Report Download - page 8
Download and view the complete annual report
Please find page 8 of the 2013 Memorex annual report below. You can navigate through the pages in the report by either clicking on the pages listed below, or by using the keyword search tool below to find specific information within the annual report.-
 1
1 -
 2
2 -
 3
3 -
 4
4 -
 5
5 -
 6
6 -
 7
7 -
 8
8 -
 9
9 -
 10
10 -
 11
11 -
 12
12 -
 13
13 -
 14
14 -
 15
15 -
 16
16 -
 17
17 -
 18
18 -
 19
19 -
20
-
21
-
22
-
23
-
24
-
25
-
26
-
27
-
28
-
29
-
30
-
31
-
32
-
33
-
34
-
35
-
36
-
37
-
38
-
39
-
40
-
41
-
42
-
43
-
44
-
45
-
46
-
47
-
48
-
49
-
50
-
51
-
52
-
53
-
54
-
55
-
56
-
57
-
58
-
59
-
60
-
61
-
62
-
63
-
64
-
65
-
66
-
67
-
68
-
69
-
70
-
71
-
72
-
73
-
74
-
75
-
76
-
77
-
78
-
79
-
80
-
81
-
82
-
83
-
84
-
85
-
86
-
87
-
88
-
89
-
90
-
91
-
92
-
93
-
94
-
95
-
96
-
97
-
98
-
99
-
100
-
101
-
102
-
103
-
104
-
105
-
106
-
107
-
108
-
109
-
110
-
111
-
112
-
113
-
114
-
115
-
116
-
117
-
118
-
119
-
120
-
121
-
122
 |
 |

Storage and Accessories (CSA) and Tiered Storage and Security Solutions (TSS). Our new reporting segments are generally
aligned with our key consumer and commercial channels. Historical segment results have been reclassified to reflect current
reporting segments.
We have two major product categories under our CSA segment: Consumer storage media and Audio and accessories
and two major product categories under our TSS segment: Commercial storage media and Storage and security solutions.
See Note 14 — Business Segment Information and Geographic Data in our Notes to Consolidated Financial Statements for
further information regarding our business segments and further discussion of our products above.
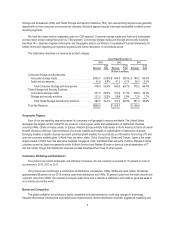
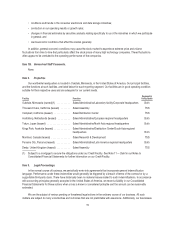
The table below describes our revenue by product category:
Years Ended December 31,
2013 2012 2011
Revenue
%of
Total Revenue
%of
Total Revenue
%of
Total
(Dollars in millions)
Consumer Storage and Accessories
Consumer storage media ........................ $435.7 50.6% $ 594.3 59.0% $ 740.2 63.4%
Audio and accessories .......................... 42.6 4.9% 41.0 4.1% 35.0 3.0%
Total Consumer Storage and Accessories ......... 478.3 55.6% 635.3 63.1% 775.2 66.4%
Tiered Storage and Security Solutions
Commercial storage media ...................... 251.0 29.2% 311.6 31.0% 378.8 32.5%
Storage and security solutions .................... 131.5 15.3% 59.8 5.9% 12.6 1.1%
Total Tiered Storage and Security Solutions ........ 382.5 44.4% 371.4 36.9% 391.4 33.6%
Total Net Revenue ............................... $860.8 $1,006.7 $1,166.6
Geographic Regions
Each of our two reporting segments serves its customers in all geographic regions worldwide. The United States
represents the largest current market for our products. It has a great variety and sophistication of distribution channels
including VARs, OEMs and retail outlets. In Europe, Western Europe exhibits traits similar to North America in terms of overall
breadth of product offerings, high penetration of end user markets and breadth of sophistication of distribution channels.
Emerging markets in Eastern Europe represent potential growth markets for our products as Information Technology (IT) end
user and consumer markets grow. In North Asia, we serve Japan, China, Hong Kong, Korea and Taiwan. Japan is the single
largest market in North Asia. We also serve Australia, Singapore, India, the Middle East and parts of Africa. Markets in these
countries as well as Japan are generally similar to North America and Western Europe in terms of overall penetration of IT
into the market, though their distribution channels are less developed than those of other regions.
Customers, Marketing and Distribution
Our products are sold to businesses and individual consumers. No one customer accounted for 10 percent or more of
our revenue in 2013, 2012 or 2011.
Our products are sold through a combination of distributors, wholesalers, VARs, OEMs and retail outlets. Worldwide,
approximately 66 percent of our 2013 revenue came from distributors and VARs, 30 percent came from the retail channel and
4 percent came from OEMs. We maintain a company sales force and a network of distributors and VARs to generate sales of
our products around the world.
Market and Competition
The global market for our products is highly competitive and characterized by continuing changes in technology,
frequent new product introductions and performance improvements, diverse distribution channels, aggressive marketing and
5