Konica Minolta 2001 Annual Report Download - page 3
Download and view the complete annual report
Please find page 3 of the 2001 Konica Minolta annual report below. You can navigate through the pages in the report by either clicking on the pages listed below, or by using the keyword search tool below to find specific information within the annual report.-
 1
1 -
 2
2 -
 3
3 -
 4
4 -
 5
5 -
 6
6 -
 7
7 -
 8
8 -
 9
9 -
 10
10 -
 11
11 -
 12
12 -
 13
13 -
 14
14 -
15
-
16
-
17
-
18
-
19
-
20
-
21
-
22
-
23
-
24
-
25
-
26
-
27
-
28
-
29
-
30
-
31
-
32
-
33
-
34
-
35
-
36
-
37
-
38
-
39
-
40
 |
 |
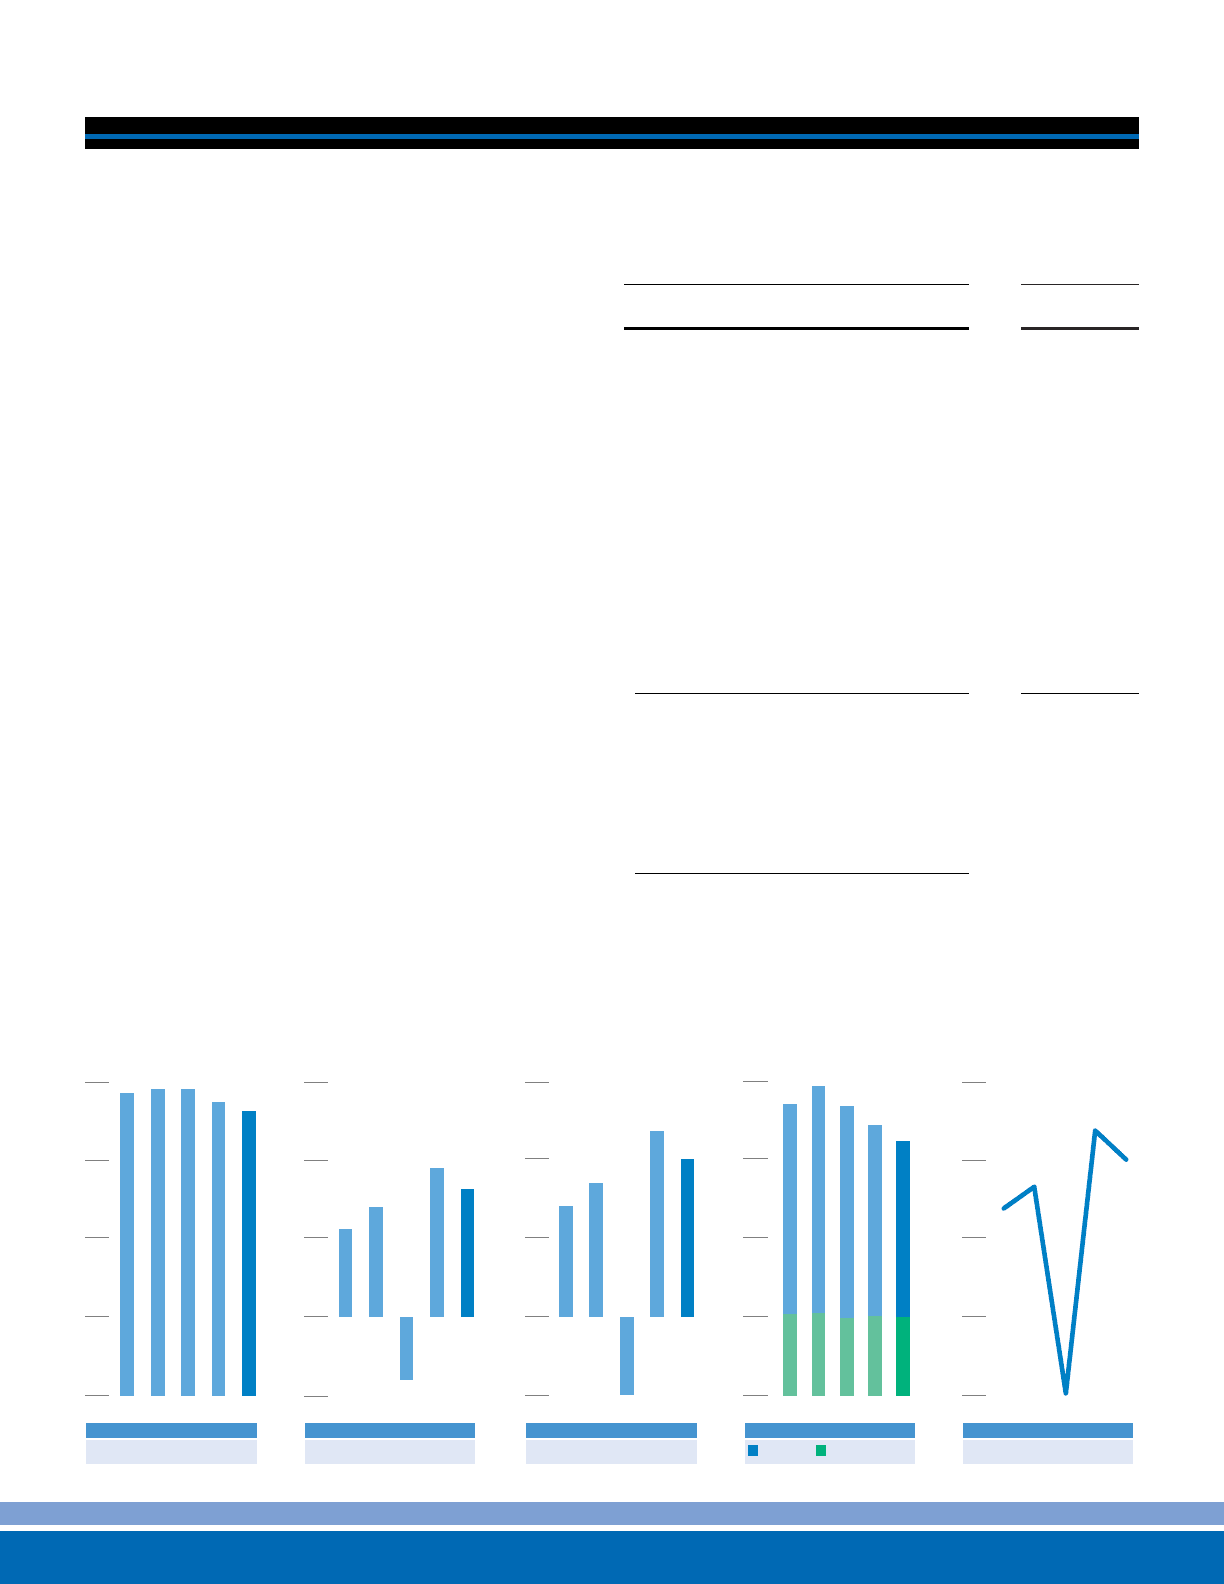
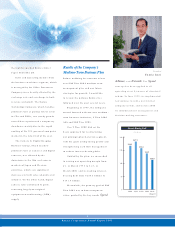
Konica Corporation/ Annual Report 200 1
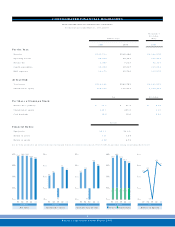
1
Thousands of
U.S. dollars
Millions of yen ( Note)
2 0 0 1 2 0 0 0 2 0 0 1
For the Year:
Net sales
¥543,719 ¥ 5 6 0 ,9 0 0 $ 4 ,3 8 8 ,3 7 0
Operating inc ome
3 0 ,5 4 3 3 3 ,1 3 1 2 4 6 ,5 1 3
Net income
6 ,4 5 7 7,627 5 2 ,1 1 5
Capital expenditure
3 0 ,4 2 4 3 0 ,2 3 7 2 4 5 ,5 5 3
R&D expenses
2 6 ,6 7 2 2 5 ,7 3 0 2 1 5 ,2 7 0
At Year-End:
Total assets
¥518,181 ¥ 5 4 9 ,7 0 3 $ 4 ,1 8 2 ,2 5 2
Shareholders’ equity
1 6 0 ,2 5 9 1 6 2 ,7 9 3 1,293,454
Yen U.S. dollars
Per Share of Common Stock:
Net income— primary
¥ 18.1 ¥ 2 1 .3 $ 0.15
Shareholders’ equity
4 4 8 .1 455.2 3 .6 2
Cash dividends
1 0 .0 1 0 .0 0 .0 8
Perc ent
Financial Ratios:
Equity ratio
30.9% 2 9 .6 %
Return on assets
1 .2 1 1 .3 4
Return on equity
4 .0 0 4 .7 4
Note: U.S. dollar amounts above and elsewhere in this report are translated from yen, for convenience only, at the rate of ¥ 12 3.90 = US$ 1, the approximate exchange rate prevailing at Marc h 31 , 2 00 1.
KONICA CORPORATION AND CONSOLIDATED SUBSIDIARIES
For the fiscal years ended Marc h 3 1 , 2 0 01 and 200 0
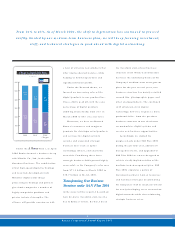
600
584.4
578.1 584.3
560.9 543.7
450
300
150
0
0100999897
Net Sales
( ¥ billions)
1 2
5 .6
4 .5
-3 .2
7 .6
6 .5
8
4
0
-4
0100999897
Net Income ( Loss)
( ¥ billions)
2 7
1 5 .4
1 2 .7
-8 .9
2 1 .3
1 8 .1
1 8
9
0
-9
0100999897
Net Income ( Loss) per Share
( ¥ )
640
6 2 9 .1
1 6 7 .1
593.0
165.3
589.2
158.7
549.7
162.8
518.2
160.3
480
320
160
0
0100999897
( ¥ billions)
6
3 .3 1
2 .7 6
-1 .9 4
4 .7 4
4 .0
4
2
0
-2
0100999897
Return on Equity
( %)
Total Assets / Shareholders’ Equity
CONSOLIDATED FINANCIAL HIGHLIGHTS