Konica Minolta 2001 Annual Report Download - page 26
Download and view the complete annual report
Please find page 26 of the 2001 Konica Minolta annual report below. You can navigate through the pages in the report by either clicking on the pages listed below, or by using the keyword search tool below to find specific information within the annual report.-
 1
1 -
2
-
3
-
4
-
5
-
6
-
7
-
8
-
9
-
10
-
11
-
12
-
13
-
14
-
15
-
 16
16 -
 17
17 -
 18
18 -
 19
19 -
 20
20 -
 21
21 -
 22
22 -
 23
23 -
 24
24 -
 25
25 -
 26
26 -
 27
27 -
 28
28 -
 29
29 -
 30
30 -
 31
31 -
 32
32 -
 33
33 -
 34
34 -
 35
35 -
 36
36 -
37
-
38
-
39
-
40
 |
 |

Konica Corporation/ Annual Report 200 1
24
$ 89,257
2 0 9 ,3 6 2
3 0 ,0 4 0
( 9 ,6 6 9 )
7 4 ,7 9 4
( 5 3 ,3 1 7 )
2 1 ,0 0 9
1 0 6 ,7 2 3
2 4 ,7 5 4
4 1 ,5 7 4
( 6 1 ,0 1 7 )
( 5 ,9 7 3 )
4 6 ,3 5 2
5 1 3 ,9 0 6
7,853
( 7 4 ,6 0 9 )
( 3 6 ,1 5 0 )
4 1 1 ,0 0 1
—
9 6 9
( 1 8 6 ,0 3 7 )
9 7 ,7 5 6
( 4 ,6 2 5 )
5 4 ,6 2 5
( 2 8 ,2 2 4 )
( 6 5 ,5 2 9 )
( 1 8 7 ,2 4 8 )
2 0 7 ,2 7 2
( 3 3 5 ,3 5 9 )
—
( 8 )
( 2 8 ,8 6 2 )
—
( 3 4 4 ,2 1 3 )
7,797
9,048
4 4 4 ,0 8 4
3,462
$ 4 5 6 ,6 0 2
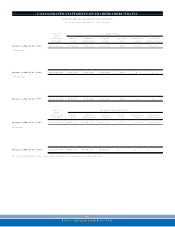
CONSOLIDATED STATEMENTS OF CASH FLOWS
KONICA CORPORATION AND CONSOLIDATED SUBSIDIARIES
For the fiscal years ended March 3 1, 2 0 01 and 2 0 0 0
Thousands of
U.S. dollars
Millions of yen ( Note 3)
2 0 0 1 2 0 0 0 2 0 0 1
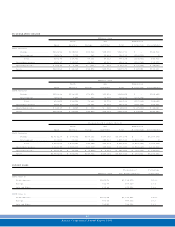
Cash Flows from Operating Activities:
Income before income taxes
Depreciation and amortization
Increase in allowance for doubtful receivables
Interest and dividend income
Interest expenses
Loss ( gain) on sales or disposals of fixed assets, net
Write-down on investment securities
Amortization of unrecognized net obligation at transition
Dec rease in notes and accounts receivable
Dec rease in inventories
Dec rease in notes and accounts payable
Dec rease in ac crued consumption tax payable
Other
Subtotal
Interest and dividend income rec eived
Interest expenses paid
Income taxes paid
Net cash provided by operating activities
Cash Flows from Investing Activities:
Payment for acquisition of marketable securities
Proceeds from the sale of marketable securities
Payment for acquisition of fixed assets
Proceeds from the sale of fixed assets
Payment for acquisition of investment securities
Proceeds from the sale of investment sec urities
Other
Net cash used in investing ac tivities
Cash Flows from Financing Activities:
Dec rease in short-term debt
Proceeds from long-term debt
Redemption of long-term debt
Proceeds from the issuance of bonds
Payments for repurchase of treasury stoc ks
Dividends paid
Other
Net cash used in financing activities
Translation differ ences on cash and cash equivalents
Incr ease in cash and cash equivalents
Cash and cash equivalents at the beginning of the year
Incr ease in cash and cash equivalents by new consolidation
Cash and cash equivalents at fiscal year-end
¥ 1 1 ,0 5 9
2 5 ,9 4 0
3 ,7 2 2
( 1 ,1 9 8 )
9 ,2 6 7
( 6 ,6 0 6 )
2 ,6 0 3
1 3 ,2 2 3
3 ,0 6 7
5 ,1 5 1
( 7 ,5 6 0 )
( 7 4 0 )
5 ,7 4 3
6 3 ,6 7 3
9 7 3
( 9 ,2 4 4 )
( 4 ,4 7 9 )
5 0 ,9 2 3
—
1 2 0
( 2 3 ,0 5 0 )
1 2 ,1 1 2
( 5 7 3 )
6 ,7 6 8
( 3 ,4 9 7 )
( 8 ,1 1 9 )
( 2 3 ,2 0 0 )
2 5 ,6 8 1
( 4 1 ,5 5 1 )
—
( 1 )
( 3 ,5 7 6 )
—
( 4 2 ,6 4 8 )
9 6 6
1 ,1 2 1
5 5 ,0 2 2
4 2 9
¥ 5 6 ,5 7 3
¥ 1 5 ,2 0 6
3 0 ,6 8 7
( 1 ,4 9 4 )
( 1 ,7 2 2 )
1 0 ,4 5 4
1,172
1,657
—
( 7 ,8 2 1 )
7,493
1 3 ,9 7 3
1,264
2,583
7 3 ,4 5 2
1,662
( 1 0 ,3 4 5 )
( 3 ,5 0 5 )
6 1 ,2 6 4
( 6 7 4 )
3,416
( 2 2 ,9 6 2 )
7,179
( 1 6 7 )
5 0 6
1,499
( 1 1 ,2 0 3 )
( 2 3 ,4 2 2 )
2 2 ,0 9 0
( 1 3 ,4 7 2 )
3,000
—
( 3 ,5 7 6 )
( 1 8 ,6 6 7 )
( 3 4 ,0 4 8 )
( 1 ,0 4 2 )
1 4 ,9 6 9
4 0 ,0 5 3
—
¥ 5 5 ,0 2 2
The accompanying Notes to Consolidated Financial Statements are an integral part of these statements.