Konica Minolta 2001 Annual Report Download - page 19
Download and view the complete annual report
Please find page 19 of the 2001 Konica Minolta annual report below. You can navigate through the pages in the report by either clicking on the pages listed below, or by using the keyword search tool below to find specific information within the annual report.-
 1
1 -
2
-
3
-
4
-
5
-
6
-
7
-
8
-
 9
9 -
 10
10 -
 11
11 -
 12
12 -
 13
13 -
 14
14 -
 15
15 -
 16
16 -
 17
17 -
 18
18 -
 19
19 -
 20
20 -
 21
21 -
 22
22 -
 23
23 -
 24
24 -
 25
25 -
 26
26 -
 27
27 -
 28
28 -
 29
29 -
30
-
31
-
32
-
33
-
34
-
35
-
36
-
37
-
38
-
39
-
40
 |
 |

Konica Corporation/ Annual Report 200 1
17
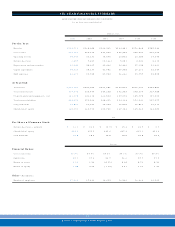
Sales Results by Segment
Sales of our photographic materials segment declined 4 .7%
compared with the previous year, to ¥3 0 6 .9 billion, but
operating income climbed to ¥1 9 .0 billion, an increase of
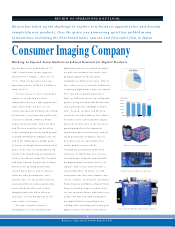
4 .8%. Although sales by the Consumer Imaging Company,
which enjoys a high relative density of sales, fell ¥ 1 8 .7
billion, due to lower prices and the yen’s revaluation, the
drop was restrained at ¥ 2 .0 billion, by cutting production
costs and fixed selling expenses as planned. The Medical
and Graphic Company enjoyed enhanced demand for dry
film and X-ray imaging system for dry film. Although sales
dropped reflec ting pricing c hanges, operating inc ome
increased.
The EM & ID Business Group ac hieved significant
advances in both sales and operating income for TAC film
used for polarizing filters in LCDs. Likewise, robust sales in
the Inkjet Business Group, where our paper media has
remained strong, helped reduce the operating loss.
Sales of our business mac hines segment showed a slight
decline of 0 .7 % from the previous year, to ¥23 9 .4 billion,
while operating income fell 1 8 .6 %, to ¥ 2 0 .2 billion. The
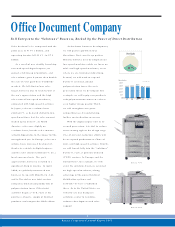
Office Doc ument Company, with its high relative density of
sales, achieved higher volume and reduced costs, but due
to the yen’s appreciation both sales amount and operating
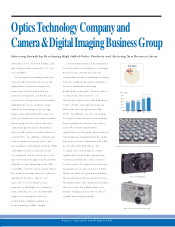
income fell ¥7.0 billion. For the Optics Tec hnology
Company, where demand continues to expand for the
aspheric al plastic lenses used in optical discs, both sales
and operating income inc reased.
Analysis of Profit and Loss
As outlined above, the overall sales amount in the fisc al year
under review was lower than in the previous period due to
such factors as the yen’s appreciation, and despite our
efforts to reduc e SG&A expenses by cutting bac k fixed
expenses. As a result, operating income fell 7 .8 % c ompared
with the previous year, to ¥ 3 0 .5 billion, and the operating
margin dropped 0 .3 percentage point, to 5.6 %.
In non-operating income and expenses, the Company
recorded a ¥1 9 .5 billion, down ¥ 1 .6 billion compared to
the previous year. Non-operating income items included
¥ 1 .2 billion in interest and dividend income, c ompared with
¥ 1 .7 billion in the previous year; ¥ 1 .6 billion in net foreign
currenc y gains, as against a loss of ¥ 4.7 billion the prior
year; and ¥ 8 .6 billion in gains on sales of fixed assets, versus
¥ 0 .3 billion a year earlier. The decrease in interest and
dividend income was due to our selling off of marketable
securities. The gains on sales of fixed assets resulted from
our disposing of the Muromachi Center Building, whic h had
been rented, in an effort to improve asset-management
efficiency.
Non-operating expense items included ¥ 9.3 billion in
interest expenses, compared with ¥1 0 .5 billion the previous
year. This drop was caused by our reduction of interest-
bearing debt. We also registered ¥2 .6 billion in valuation
loss on investment securities, which resulted from our
applying new standards for market value appraisal to
investment securities, in line with the Japanese accounting
standard. Reflecting the Japanese accounting standard for
retirement benefits payable, a net pension expense of
¥ 1 3 .2 billion was recorded upon the introduc tion of the
new standard.
Consequently, income before provision for income taxes
decreased 2 7 .3% from the previous fisc al year, to ¥1 1 .1
billion, and net income fell 15 .3%, to ¥ 6 .5 billion.
Net income per share of common stock was ¥ 1 8 .0 6 ,
down from ¥2 1 .3 3 the previous year. Return on equity
dropped to 4.0 0 %, from 4 .74%, and return on assets
declined to 1.2 1 %, from 1 .34 %.