Konica Minolta 2001 Annual Report Download - page 15
Download and view the complete annual report
Please find page 15 of the 2001 Konica Minolta annual report below. You can navigate through the pages in the report by either clicking on the pages listed below, or by using the keyword search tool below to find specific information within the annual report.
Konica Corporation/ Annual Report 200 1
13
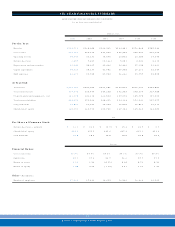
Millions of yen
2 0 0 1 2 0 0 0 1 9 9 9 1 9 9 8 1 9 9 7 1 9 9 6
For the Year:
Net sales
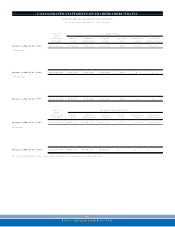
¥543,719 ¥560,900 ¥584,342 ¥584,401 ¥578,080 ¥505,348
Cost of sales
3 1 9 ,1 6 3 3 2 3 ,7 1 0 3 4 2 ,5 4 3 3 4 2 ,4 5 2 3 4 5 ,2 3 7 2 9 7 ,8 6 4
Operating inc ome
3 0 ,5 4 3 3 3 ,1 3 1 1 4 ,5 7 5 2 3 ,0 6 2 2 3 ,6 0 4 1 7 ,6 7 4
Net income ( loss)
6 ,4 5 7 7,627 (3,166) 5,501 4,541 2,118
Depreciation and amortization
2 5 ,9 4 0 3 0 ,6 8 7 3 2 ,4 8 8 2 8 ,4 8 8 2 7 ,1 3 0 2 9 ,4 8 1
Capital expenditure
3 0 ,4 2 4 3 0 ,2 3 7 4 2 ,7 0 2 4 7 ,8 5 0 2 8 ,2 6 1 3 2 ,6 4 8
R&D expenses
2 6 ,6 7 2 2 5 ,7 3 0 2 7 ,9 4 4 2 6 ,6 6 6 2 3 ,9 5 7 2 2 ,0 5 0
At Year-End:
Total assets
¥518,181 ¥549,703 ¥589,201 ¥629,062 ¥592,997 ¥552,008
Total current assets
3 1 7 ,8 9 0 3 3 5 ,8 9 9 3 4 9 ,2 4 0 3 9 2 ,8 5 5 3 7 0 ,3 9 9 3 2 7 ,9 0 0
Property, plant and equipment— net
1 4 1 ,8 7 0 1 4 1 ,1 1 4 1 6 1 ,5 3 4 1 5 9 ,8 7 3 1 4 5 ,9 7 0 1 3 9 ,8 8 2
Total current liabilities
2 6 2 ,2 7 3 2 7 2 ,5 6 8 2 8 0 ,9 2 2 3 2 4 ,1 9 4 2 7 9 ,2 4 1 2 5 7 ,5 7 7
Long-term debt
5 7 ,0 9 9 7 7 ,6 5 7 9 4 ,3 4 4 7 6 ,0 1 0 8 7 ,0 1 8 6 7 ,8 1 8
Shareholders’ equity
1 6 0 ,2 5 9 1 6 2 ,7 9 3 1 5 8 ,7 4 2 1 6 7 ,1 4 4 1 6 5 ,2 6 8 1 6 4 ,3 0 3
Yen
Per Share of Common Stock:
Net income ( loss) — primary
¥1 8 .1 ¥ 21.3 ¥ ( 8.9) ¥ 15.4 ¥ 12.7 ¥ 5.9
Shareholders’ equity
4 4 8 .1 455.2 443.8 467.3 462.1 459.4
Cash dividends
1 0 .0 1 0 .0 1 0 .0 1 0 .0 1 0 .0 1 0 .0
Perc ent
Financial Ratios:
Cost of sales ratio
58.7% 5 7 .7 % 5 8 .6 % 5 8 .6 % 5 9 .7 % 5 8 .9 %
Equity ratio
3 0 .9 2 9 .6 2 6 .9 2 6 .6 2 7 .9 2 9 .8
Return on assets
1 .2 1 1 .3 4 ( 0 .5 2 ) 0 .9 0 0 .7 9 0 .3 9
Return on equity
4 .0 0 4 .7 4 ( 1 .9 4 ) 3 .3 1 2 .7 6 1 .2 7
Other ( Persons) :
Number of employees
1 7 ,5 9 5 1 7 ,8 3 9 1 8 ,9 5 3 1 8 ,3 8 8 1 8 ,6 6 4 1 8 ,5 6 3
SIX-YEAR FINANCIAL SUMMARY
KONICA CORPORATION AND CONSOLIDATED SUBSIDIARIES
For the fiscal years ended Marc h 3 1


