Konica Minolta 2001 Annual Report Download - page 16
Download and view the complete annual report
Please find page 16 of the 2001 Konica Minolta annual report below. You can navigate through the pages in the report by either clicking on the pages listed below, or by using the keyword search tool below to find specific information within the annual report.-
 1
1 -
2
-
3
-
4
-
5
-
 6
6 -
 7
7 -
 8
8 -
 9
9 -
 10
10 -
 11
11 -
 12
12 -
 13
13 -
 14
14 -
 15
15 -
 16
16 -
 17
17 -
 18
18 -
 19
19 -
 20
20 -
 21
21 -
 22
22 -
 23
23 -
 24
24 -
 25
25 -
 26
26 -
27
-
28
-
29
-
30
-
31
-
32
-
33
-
34
-
35
-
36
-
37
-
38
-
39
-
40
 |
 |

Konica Corporation/ Annual Report 200 1
14
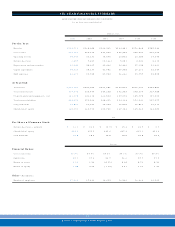
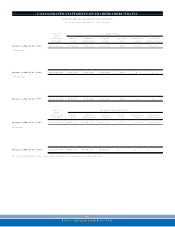
SEGMENT INFORMATION
KONICA CORPORATION AND CONSOLIDATED SUBSIDIARIES
For the fiscal years ended March 3 1
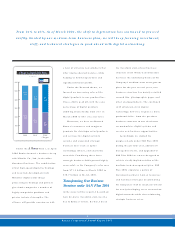
Segment Information by Product
Millions of yen
2 0 0 1 2 0 0 0 1 9 9 9 1 9 9 8 1 9 9 7 1 9 9 6
Net sales:
Photographic materials
¥305,200 ¥ 3 2 1 ,0 8 4 ¥ 3 3 6 ,6 4 3 ¥ 3 5 4 ,1 0 1 ¥ 3 5 7 ,2 9 8 ¥ 3 2 7 ,0 8 8
Business mac hines
2 3 8 ,5 1 8 2 3 9 ,8 1 6 2 4 7 ,6 9 8 2 3 0 ,3 0 0 2 2 0 ,7 8 2 1 7 8 ,2 6 0
Consolidated
¥543,719 ¥ 5 6 0 ,9 0 0 ¥ 5 8 4 ,3 4 2 ¥ 5 8 4 ,4 0 1 ¥ 5 7 8 ,0 8 0 ¥ 5 0 5 ,3 4 8
Operating inc ome:
Photographic materials
¥ 1 9 ,0 2 2 ¥ 1 8 ,1 5 8 ¥ 3 ,0 4 1 ¥ 1 4 ,0 3 4 ¥ 1 5 ,5 8 3 ¥ 1 5 ,8 1 6
Business mac hines
2 0 ,1 7 4 2 4 ,7 8 6 1 8 ,0 8 6 1 8 ,4 9 0 1 0 ,7 8 2 6 ,4 3 8
Total
3 9 ,1 9 7 4 2 ,9 4 5 2 1 ,1 2 8 3 2 ,5 2 5 2 6 ,3 6 6 2 2 ,2 5 5
Elimination and corporate
( 8 ,6 5 4 ) ( 9 ,8 1 3 ) ( 6 ,5 5 3 ) ( 9 ,4 6 2 ) ( 2 ,7 6 1 ) ( 4 ,5 8 1 )
Consolidated
¥ 3 0 ,5 4 3 ¥ 3 3 ,1 3 1 ¥ 1 4 ,5 7 5 ¥ 2 3 ,0 6 2 ¥ 2 3 ,6 0 4 ¥ 1 7 ,6 7 4
Domestic Sales and Export Sales
Millions of yen
2 0 0 1 2 0 0 0 1 9 9 9 1 9 9 8 1 9 9 7 1 9 9 6
Domestic sales ( Note 1)
¥249,473 ¥ 2 5 6 ,8 2 4 ¥ 2 5 4 ,1 9 3 ¥ 2 6 3 ,7 3 0 ¥ 2 7 1 ,0 0 7 ¥ 2 6 0 ,3 7 5
Export sales ( Note 2 ) :
2 9 4 ,2 4 6 3 0 4 ,0 7 6 3 3 0 ,1 4 9 3 2 0 ,6 7 1 3 0 7 ,0 7 3 2 4 4 ,9 7 3
North America
1 4 0 ,0 7 8 1 3 9 ,3 8 0 1 5 6 ,5 8 3 1 4 5 ,1 5 3 — —
Europe
7 2 ,9 6 8 8 5 ,6 9 4 1 0 3 ,0 1 0 9 8 ,3 0 0 — —
Asia and other
8 1 ,1 9 9 7 9 ,0 0 1 7 0 ,5 5 5 7 7 ,2 1 8 — —
Ratio of export sales to net sales
54.1% 5 4 .2 % 5 6 .5 % 5 4 .9 % 5 3 .1 % 4 8 .5 %
Net sales
¥543,719 ¥ 5 6 0 ,9 0 0 ¥ 5 8 4 ,3 4 2 ¥ 5 8 4 ,4 0 1 ¥ 5 7 8 ,0 8 0 ¥ 5 0 5 ,3 4 8
Notes: 1 . Domestic sales are sales to customers in Japan by the Company and its consolidated subsidiaries.
2 . Export sales are sales to customer s outside Japan by the Company and its consolidated subsidiaries.