JCPenney 2010 Annual Report Download - page 24
Download and view the complete annual report
Please find page 24 of the 2010 JCPenney annual report below. You can navigate through the pages in the report by either clicking on the pages listed below, or by using the keyword search tool below to find specific information within the annual report.-
 1
1 -
2
-
3
-
4
-
5
-
6
-
7
-
8
-
9
-
10
-
11
-
12
-
13
-
 14
14 -
 15
15 -
 16
16 -
 17
17 -
 18
18 -
 19
19 -
 20
20 -
 21
21 -
 22
22 -
 23
23 -
 24
24 -
 25
25 -
 26
26 -
 27
27 -
 28
28
 |
 |

Comparable store sales are presented on a 52-week basis and include sales from new and relocated stores that have been opened for 12 consecutive full scal months and online sales through
jcp.com. Stores closed for an extended period are not included in comparable store sales calculations, while stores remodeled and minor expansions not requiring store closures remain in the
calculations. Our denition and calculation of comparable store sales may differ from other companies in the retail industry.
Adjusted income from continuing operations and adjusted diluted earnings per share (EPS) from continuing operations exclude the non-cash impact of our primary pension plan expense/(income),
net of income tax and are considered non-GAAP nancial measures under the rules of the Securities and Exchange Commission (SEC). Their most directly comparable GAAP nancial measures are
income from continuing operations and diluted EPS from continuing operations. The primary pension plan expense/(income), net of income tax was $135 million or $0.57 per share in 2010; $184
million, or $0.79 per share in 2009; and $(83) million, or $(0.37) per share in 2008. In 2010, income from continuing operations of $378 million or $1.59 per share plus $135 million or $0.57 per
share of non-cash primary pension plan expense, net of income tax, provided adjusted income from continuing operations of $513 million and adjusted EPS from continuing operations of $2.16 per
share. In 2009, income from continuing operations of $249 million, or $1.07 per share, plus $184 million, or $0.79 per share of non-cash primary pension plan expense, net of income tax, provided
adjusted income from continuing operations of $433 million and adjusted EPS from continuing operations of $1.86. In 2008, income from continuing operations of $567 million, or $2.54 per share,
less $83 million, or $0.37 per share of non-cash primary pension plan income, net of income tax, provided adjusted income from continuing operations of $484 million and adjusted EPS from
continuing operations of $2.17.
Free cash ow is dened as net cash provided by operating activities excluding discretionary cash contributions to our primary pension plan and associated tax impact, less capital expenditures and
dividends paid, plus proceeds from the sale of assets. Free cash ow is considered a non-GAAP nancial measure under the rules of the SEC; its most directly comparable GAAP nancial measure
is net cash provided by operating activities. In 2010, net cash provided by operating activities of $592 million excluding $392 million of a discretionary pension contribution, less $152 million of
related tax benet from the pension contribution, less $499 million of capital expenditures, less $189 million of dividends paid, plus $14 million of proceeds from the sale of assets provided $158
million of free cash ow. In 2009, net cash provided by operating activities of $1,573 million excluding $126 million of tax benet of a discretionary stock contribution to our primary pension plan
less $600 million of capital expenditures, less $183 million of dividends paid, plus $13 million of proceeds from the sale of assets provided $677 million of free cash ow. In 2008, net cash provided
by operating activities of $1,156 million less $969 million of capital expenditures, less $178 million of dividends paid, plus $13 million of proceeds from the sale of assets provided $22 million of
free cash ow.
(1)
(2)
(3)
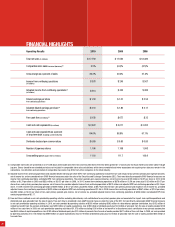
Operating Results 2010 2009 2008
Total net sales (in millions) $ 17,759 $ 17,556 $ 18,486
Comparable store sales increase/(decrease)(1) 2.5% (6.3)% (8.5)%
Gross margin as a percent of sales 39.2% 39.4% 37.4%
Income from continuing operations $ 378 $ 249 $ 567
(in millions)
Adjusted income from continuing operations(2) $ 513 $ 433 $ 484
(in millions)
Diluted earnings per share $ 1.59 $ 1.07 $ 2.54
from continuing operations
Adjusted diluted earnings per share(2) $ 2.16 $ 1.86 $ 2.17
from continuing operations
Free cash ow (in millions)
(3) $ 158 $ 677 $ 22
Cash and cash equivalents (in millions) $ 2,622 $ 3,011 $ 2,352
Cash and cash equivalents as a percent 84.6% 88.8% 67.1%
of long-term debt, including current maturities
Dividends declared per common share $ 0.80 $ 0.80 $ 0.80
Number of jcpenney stores 1,106 1,108 1,093
Gross selling space (square feet in millions) 111.6 111.7 109.9
24
FINANCIAL HIGHLIGHTS