Hyundai 2015 Annual Report Download - page 83
Download and view the complete annual report
Please find page 83 of the 2015 Hyundai annual report below. You can navigate through the pages in the report by either clicking on the pages listed below, or by using the keyword search tool below to find specific information within the annual report.-
 1
1 -
2
-
3
-
4
-
5
-
6
-
7
-
8
-
9
-
10
-
11
-
12
-
13
-
14
-
15
-
16
-
17
-
18
-
19
-
20
-
21
-
22
-
23
-
24
-
25
-
26
-
27
-
28
-
29
-
30
-
31
-
32
-
33
-
34
-
35
-
36
-
37
-
38
-
39
-
40
-
41
-
42
-
43
-
44
-
45
-
46
-
47
-
48
-
49
-
50
-
51
-
52
-
53
-
54
-
55
-
56
-
57
-
58
-
59
-
60
-
61
-
62
-
63
-
64
-
65
-
66
-
67
-
68
-
69
-
70
-
71
-
72
-
 73
73 -
 74
74 -
 75
75 -
 76
76 -
 77
77 -
 78
78 -
 79
79 -
 80
80 -
 81
81 -
 82
82 -
 83
83 -
 84
84 -
 85
85 -
 86
86 -
 87
87 -
 88
88 -
 89
89 -
 90
90 -
 91
91 -
 92
92
 |
 |

HYUNDAI MOTOR COMPANY Annual Report 2015
164 165
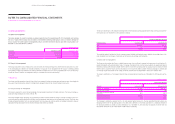
c) Equity price risk
The Group is exposed to market price fluctuation risk arising from equity instruments. As of December 31, 2015, the amounts of
held for trading equity instruments and AFS equity instruments measured at fair value are ₩ 90,363 million and ₩ 2,419,104 mil-
lion, respectively.
2) Credit risk
The Group is exposed to credit risk when a counterparty defaults on its contractual obligation resulting in a financial loss for the
Group. The Group operates a policy to transact with counterparties who only meet a certain level of credit rating which was eval-
uated based on the counterparty’s financial conditions, default history, and other factors. The credit risk in the liquid funds and
derivative financial instruments is limited as the Group transacts only with financial institutions with high credit-ratings assigned
by international credit-rating agencies. Except for the guarantee of indebtedness discussed in Note 37, the book value of finan-
cial assets in the consolidated financial statements represents the maximum amounts of exposure to credit risk.
3) Liquidity risk
The Group manages liquidity risk based on maturity profile of its funding. The Group analyses and reviews actual cash outflow
and its budget to match the maturity of its financial liabilities to that of its financial assets.
Due to the inherent nature of the industry, the Group requires continuous R&D investment and is sensitive to economic fluctu-
ations. The Group minimizes its credit risk in cash equivalents by investing in risk-free assets. In addition, the Group has agree-
ments in place with financial institutions with respect to trade financing and overdraft to mitigate any significant unexpected
market deterioration. The Group, also, continues to strengthen its credit rates to secure a stable financing capability.
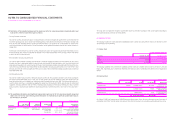
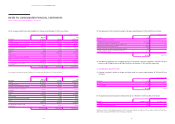
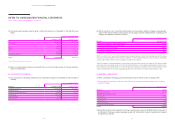
The Group’s maturity analysis of its non-derivative liabilities according to their remaining contract period before expiration as of
December 31, 2015 is as follows:
In millions of Korean Won
Remaining contract period
Description
Not later than
one year
Later than one year
and not later than
five years
Later than
five years Total
Non interest-bearing liabilities ₩ 15,465,397 ₩ 1,351 ₩ 703 ₩ 15,467,451
Interest-bearing liabilities 21,472,053 45,085,595 1,610,530 68,168,178
Financial guarantee 1,175,313 64,561 26,029 1,265,903
The maturity analysis is based on the non-discounted cash flows and the earliest maturity date at which payments, i.e. both prin-
cipal and interest, should be made.
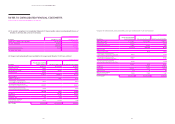
(3) Derivative instrument
The Group enters into derivative instrument contracts such as forwards, options and swaps to hedge its exposure to changes in
foreign exchange rate.
As of December 31, 2015 and 2014, the Group deferred a net loss of ₩ 31,003 million and ₩ 30,363 million, respectively, in accu-
mulated other comprehensive loss, on its effective cash flow hedging instruments.
The longest period in which the forecasted transactions are expected to occur is within 74 months as of December 31, 2015.
For the years ended December 31, 2015 and 2014, the Group recognizes a net profit of ₩ 226,254 million and ₩ 178,547 million
in profit or loss (before tax), respectively, which resulted from the ineffective portion of its cash flow hedging instruments and
changes in the valuation of its other non-hedging derivative instruments.
NOTES TO CONSOLIDATED FINANCIAL STATEMENTS
AS OF AND FOR THE YEARS ENDED DECEMBER 31, 2015 AND 2014