Hyundai 2015 Annual Report Download - page 73
Download and view the complete annual report
Please find page 73 of the 2015 Hyundai annual report below. You can navigate through the pages in the report by either clicking on the pages listed below, or by using the keyword search tool below to find specific information within the annual report.-
 1
1 -
2
-
3
-
4
-
5
-
6
-
7
-
8
-
9
-
10
-
11
-
12
-
13
-
14
-
15
-
16
-
17
-
18
-
19
-
20
-
21
-
22
-
23
-
24
-
25
-
26
-
27
-
28
-
29
-
30
-
31
-
32
-
33
-
34
-
35
-
36
-
37
-
38
-
39
-
40
-
41
-
42
-
43
-
44
-
45
-
46
-
47
-
48
-
49
-
50
-
51
-
52
-
53
-
54
-
55
-
56
-
57
-
58
-
59
-
60
-
61
-
62
-
 63
63 -
 64
64 -
 65
65 -
 66
66 -
 67
67 -
 68
68 -
 69
69 -
 70
70 -
 71
71 -
 72
72 -
 73
73 -
 74
74 -
 75
75 -
 76
76 -
 77
77 -
 78
78 -
 79
79 -
 80
80 -
 81
81 -
 82
82 -
 83
83 -
84
-
85
-
86
-
87
-
88
-
89
-
90
-
91
-
92
 |
 |

HYUNDAI MOTOR COMPANY Annual Report 2015
144 145
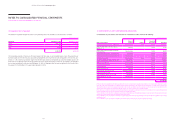
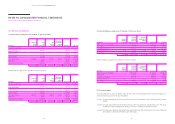
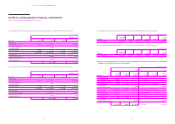
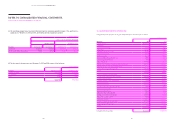
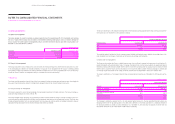
(5) Financial assets and liabilities subject to offsetting, financial instruments subject to an enforceable master netting
arrangement or similar agreement as of December 31, 2015 consist of the following:
In millions of Korean Won
Description
Gross
amounts
of recognized
financial
assets
and liabilities
Gross
amounts
of recognized
financial
assets
and liabilities
set off in the
consolidated
statement of
financial
position
Net
amounts of
financial
assets
and liabilities
presented in
the
consolidated
statement of
financial
position
Related
amounts not
set
off in the
consolidated
statement of
financial
position -
financial
instruments
Related
amounts not
set off in the
statement of
financial
position -
collateral
received
(pledged) Net amounts
Financial assets:
Trade notes and accounts receivable ₩ 4,662,777 ₩ 126,835 ₩ 4,535,942 - - ₩ 4,535,942
Other receivables 3,409,550 237,160 3,172,390 - - 3,172,390
Financial assets at FVTPL (*) 31,335 -31,335 8,142 -23,193
Derivative assets that are
effective hedging instruments (*) 220,824 -220,824 94,642 -126,182
₩ 8,324,486 ₩ 363,995 ₩ 7,960,491 ₩ 102,784 -₩ 7,857,707
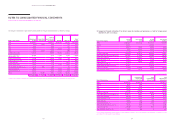
Financial liabilities:
Trade notes and accounts payable ₩ 7,433,110 ₩ 351,986 ₩ 7,081,124 - - ₩ 7,081,124
Other payables 4,725,557 12,009 4,713,548 - - 4,713,548
Financial liabilities at FVTPL (*) 37,448 -37,448 8,142 -29,306
Derivative liabilities that are
effective hedging instruments (*) 161,290 -161,290 94,642 -66,648
₩ 12,357,405 ₩ 363,995 ₩ 11,993,410 ₩ 102,784 -₩ 11,890,626
(*) These are derivative assets and liabilities that the Group may have the right to offset in the event of default, insolvency or bankruptcy of the counterparty although these
do not meet the criteria of offsetting under K-IFRS 1032.
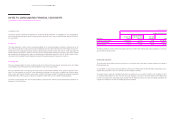
Financial assets and liabilities subject to offsetting, financial instruments subject to an enforceable master netting arrangement
or similar agreement as of December 31, 2014 consist of the following:
In millions of Korean Won
Description
Gross
amounts
of recognized
financial
assets
and liabilities
Gross
amounts
of recognized
financial
assets
and liabilities
set off in the
consolidated
statement of
financial
position
Net
amounts of
financial
assets
and liabilities
presented in
the
consolidated
statement of
financial
position
Related
amounts not
set
off in the
consolidated
statement of
financial
position -
financial
instruments
Related
amounts not
set off in the
statement of
financial
position -
collateral
received
(pledged) Net amounts
Financial assets:
Trade notes and accounts receivable ₩ 3,917,901 ₩ 116,275 ₩ 3,801,626 - - ₩ 3,801,626
Other receivables 3,421,842 277,916 3,143,926 - - 3,143,926
Financial assets at FVTPL (*) 66,947 -66,947 - - 66,947
Derivative assets that are
effective hedging instruments 39,002 -39,002 28,980 -10,022
₩ 7,445,692 ₩ 394,191 ₩ 7,051,501 ₩ 28,980 -₩ 7,022,521
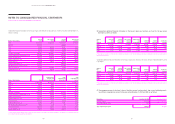
Financial liabilities:
Trade notes and accounts payable ₩ 7,319,804 ₩ 278,275 ₩ 7,041,529 - - ₩ 7,041,529
Other payables 4,804,728 115,916 4,688,812 - - 4,688,812
Financial liabilities at FVTPL (*) 10,331 -10,331 - - 10,331
Derivative liabilities that are
effective hedging instruments 414,029 -414,029 28,980 -385,049
₩ 12,548,892 ₩ 394,191 ₩ 12,154,701 ₩ 28,980 -₩ 12,125,721
(*) There are no derivative assets and liabilities that can be offset as of December 31, 2014. Therefore, the derivative assets and liabilities do not meet the criteria for
offsetting in K-IFRS 1032, but the Group has a right of offsetting them in the event of default, insolvency or bankruptcy of the counterparty.
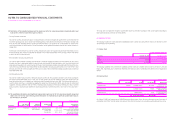
(6) The commission income (financial services revenue) arising from financial assets or liabilities other than financial
assets or liabilities at FVTPL for the years ended December 31, 2015 and 2014 are ₩ 1,717,992 million and ₩ 1,646,656
million, respectively. In addition, the fee expenses (cost of sales from financial services) occurring from financial
assets or liabilities other than financial assets or liabilities at FVTPL for the years ended December 31, 2015 and 2014
are ₩ 837,455 million and ₩ 787,994 million, respectively.
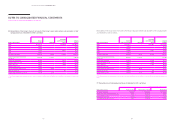
(7) The Group recognizes transfers between levels of the fair value hierarchy at the date of the event or change in
circumstances that caused the transfer. There are no significant transfers between Level 1 and Level 2 for the year
ended December 31, 2015.
NOTES TO CONSOLIDATED FINANCIAL STATEMENTS
AS OF AND FOR THE YEARS ENDED DECEMBER 31, 2015 AND 2014