Hyundai 2015 Annual Report Download - page 8
Download and view the complete annual report
Please find page 8 of the 2015 Hyundai annual report below. You can navigate through the pages in the report by either clicking on the pages listed below, or by using the keyword search tool below to find specific information within the annual report.-
 1
1 -
 2
2 -
 3
3 -
 4
4 -
 5
5 -
 6
6 -
 7
7 -
 8
8 -
 9
9 -
 10
10 -
 11
11 -
 12
12 -
 13
13 -
 14
14 -
 15
15 -
 16
16 -
 17
17 -
 18
18 -
 19
19 -
20
-
21
-
22
-
23
-
24
-
25
-
26
-
27
-
28
-
29
-
30
-
31
-
32
-
33
-
34
-
35
-
36
-
37
-
38
-
39
-
40
-
41
-
42
-
43
-
44
-
45
-
46
-
47
-
48
-
49
-
50
-
51
-
52
-
53
-
54
-
55
-
56
-
57
-
58
-
59
-
60
-
61
-
62
-
63
-
64
-
65
-
66
-
67
-
68
-
69
-
70
-
71
-
72
-
73
-
74
-
75
-
76
-
77
-
78
-
79
-
80
-
81
-
82
-
83
-
84
-
85
-
86
-
87
-
88
-
89
-
90
-
91
-
92
 |
 |
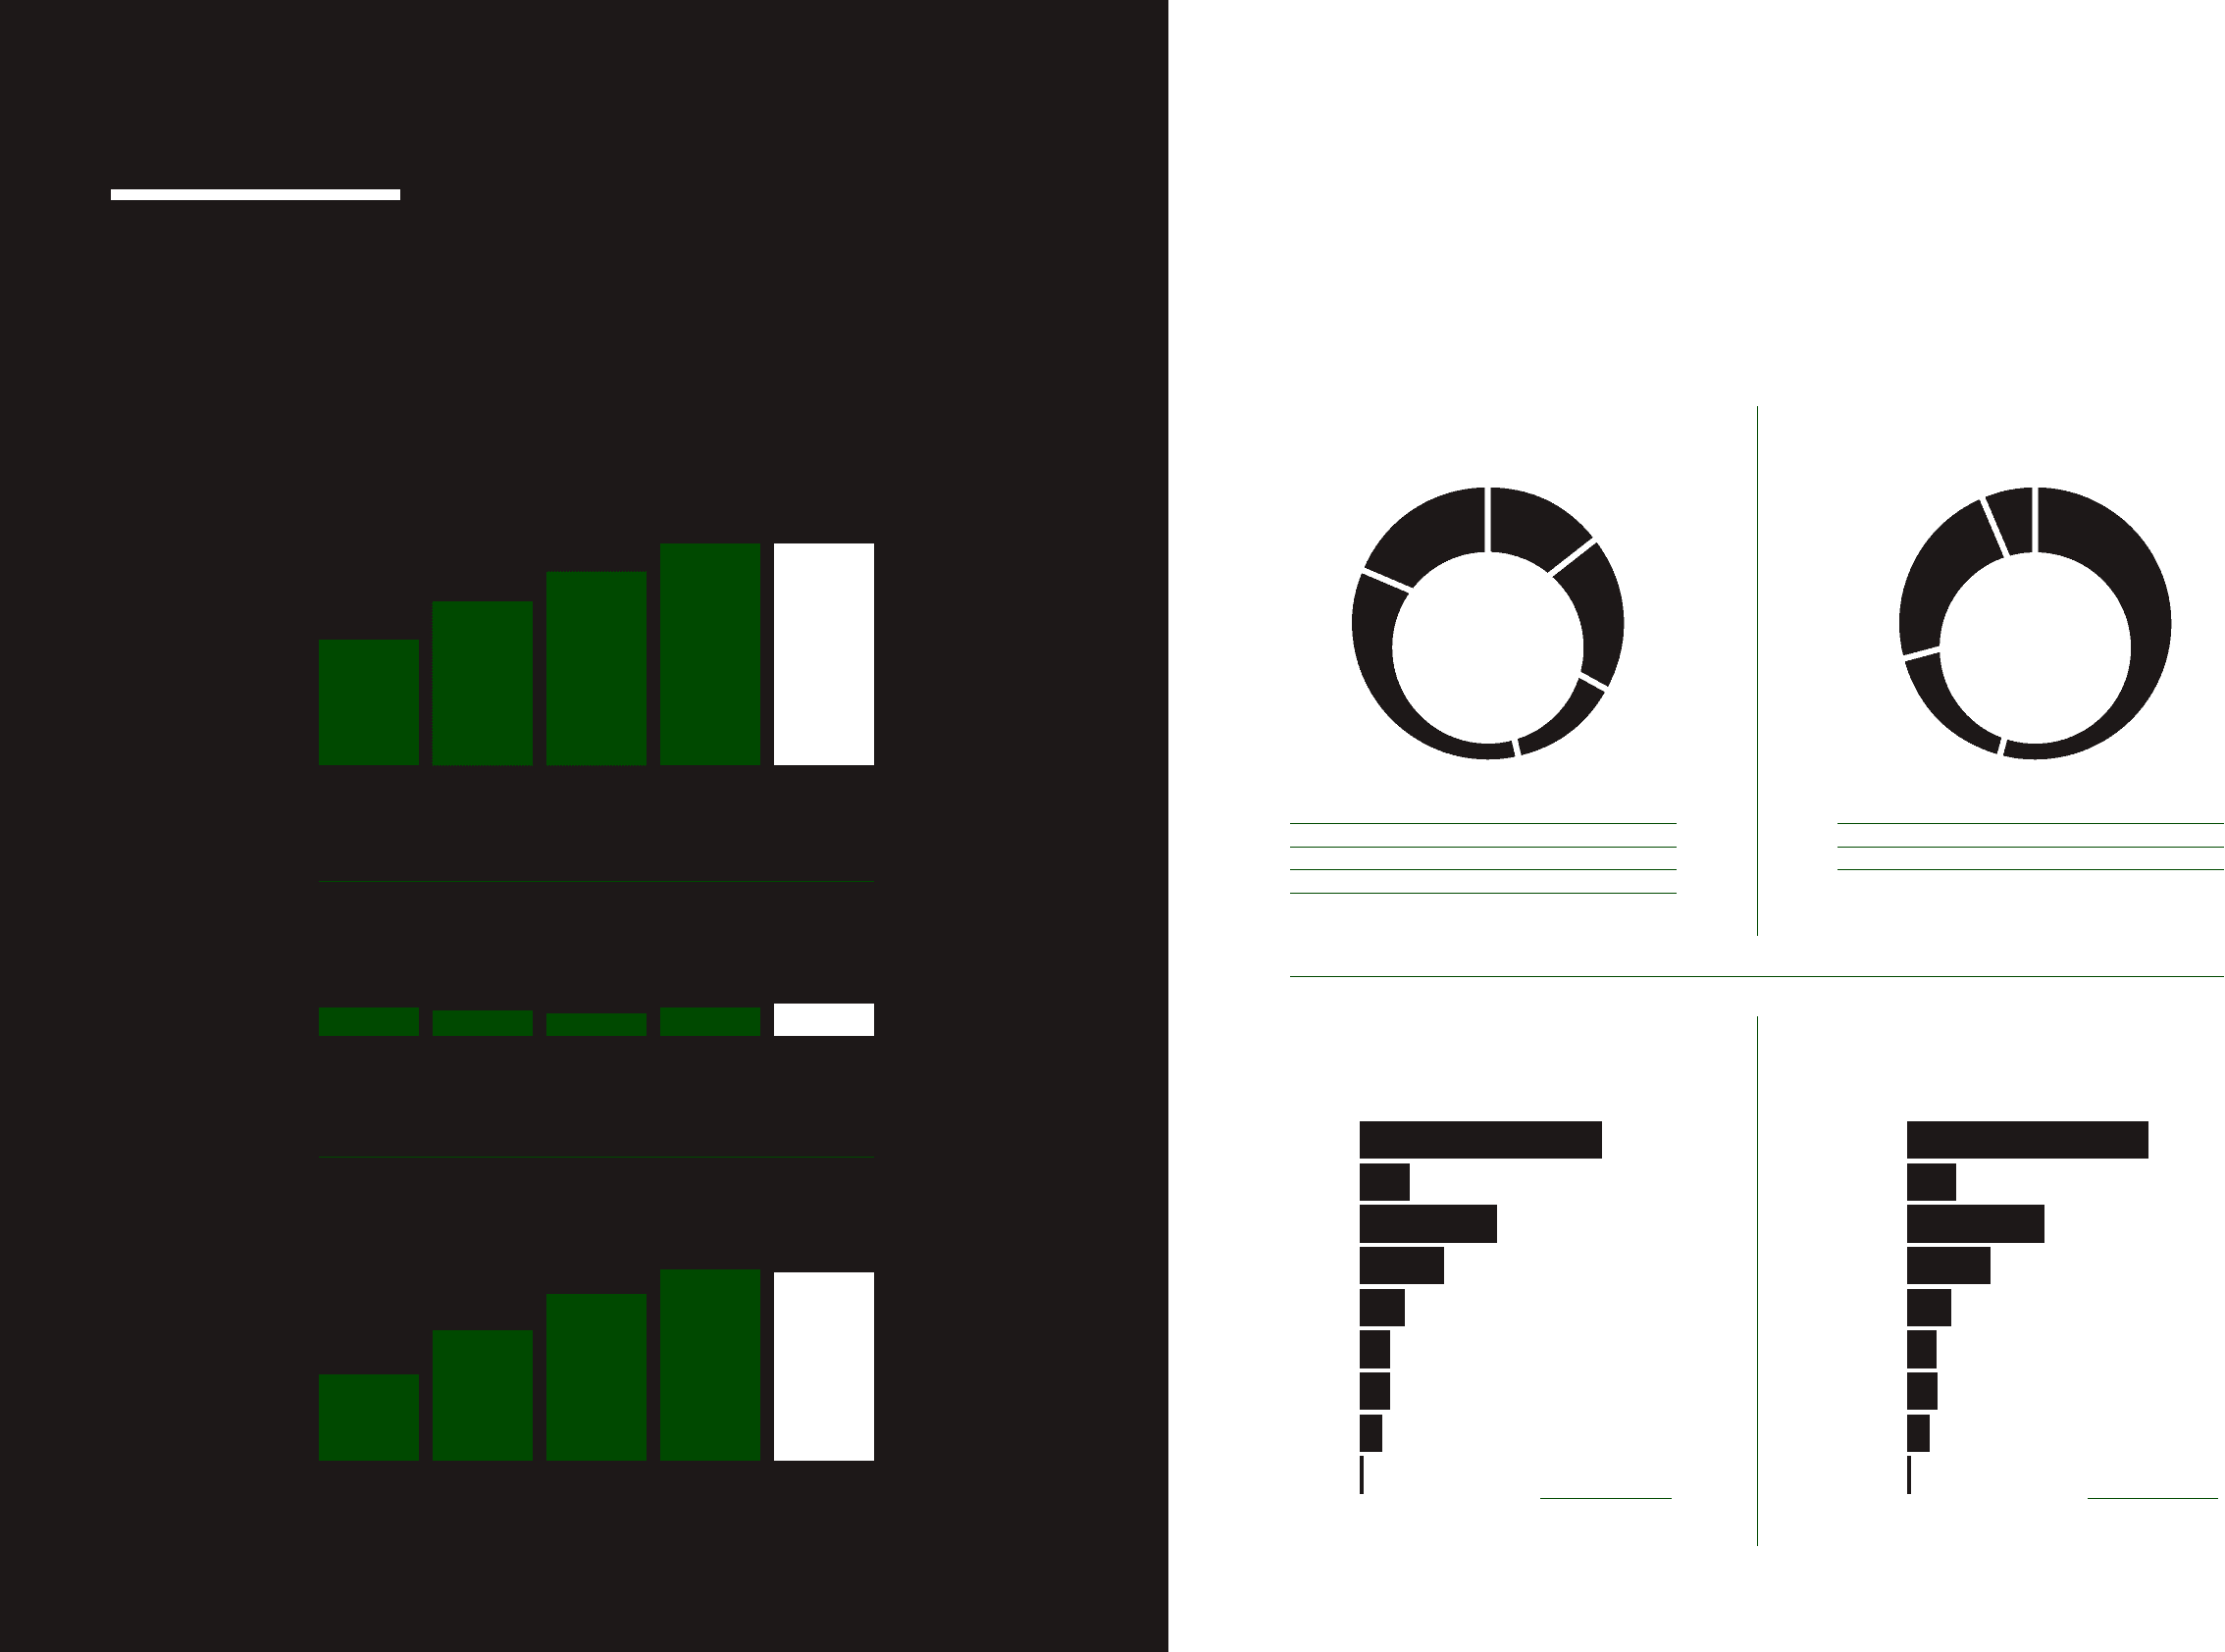
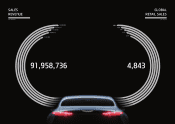
GLOBAL RETAIL SALES SALES BY REGION SALES BY SEGMENT
Unit : Thousand Unit : Thousand Unit : Thousand
SALES BY PLANT PRODUCTION BY PLANT
Unit : Thousand Unit : Thousand
1. Korea 712 14.7%
2. N. America 897 18.5%
3. Europe 650 13.4%
4. Asia 1,686 34.8%
5. Others 898 18.5%
1. Small PC 2,628 54.3%
2. Mid-Large PC 815 16.8%
3. RV 1,101 22.7%
4. CV 299 6.2%
Total
4,843
Total
4,843
Total 4,963 Total 4,948
BUSINESS HIGHLIGHTS
20122011 2013 2014 2015
4,099
4,392
4,621
4,835 4,843
Total
20122011 2013 2014 2015
682 667 641 684 712
Korea
20122011 2013 2014 2015
3,417
3,724
3,980
4,151 4,130
Overseas
1
1
2
3
4
2
3
4
5
Korea 1,867
37.6% 37.6% 1,858
Korea
US 380
7.7% 7.8% 385
US
China 1,063
21.4% 21.3% 1,052
China
India 643
13.0% 13.0% 645
India
Czech 342
6.9% 6.9% 342
Czech
Russia 230
4.6% 4.6% 230
Russia
Turkey 231
4.7% 4.7% 231
Turkey
Brazil 174
3.5% 3.5% 175
Brazil
China(CV) 32
0.6% 0.6% 31
China(CV)
1615
HYUNDAI MOTOR COMPANY Annual Report 2015