Holiday Inn 2009 Annual Report Download - page 99
Download and view the complete annual report
Please find page 99 of the 2009 Holiday Inn annual report below. You can navigate through the pages in the report by either clicking on the pages listed below, or by using the keyword search tool below to find specific information within the annual report.-
 1
1 -
2
-
3
-
4
-
5
-
6
-
7
-
8
-
9
-
10
-
11
-
12
-
13
-
14
-
15
-
16
-
17
-
18
-
19
-
20
-
21
-
22
-
23
-
24
-
25
-
26
-
27
-
28
-
29
-
30
-
31
-
32
-
33
-
34
-
35
-
36
-
37
-
38
-
39
-
40
-
41
-
42
-
43
-
44
-
45
-
46
-
47
-
48
-
49
-
50
-
51
-
52
-
53
-
54
-
55
-
56
-
57
-
58
-
59
-
60
-
61
-
62
-
63
-
64
-
65
-
66
-
67
-
68
-
69
-
70
-
71
-
72
-
73
-
74
-
75
-
76
-
77
-
78
-
79
-
80
-
81
-
82
-
83
-
84
-
85
-
86
-
87
-
88
-
 89
89 -
 90
90 -
 91
91 -
 92
92 -
 93
93 -
 94
94 -
 95
95 -
 96
96 -
 97
97 -
 98
98 -
 99
99 -
 100
100 -
 101
101 -
 102
102 -
 103
103 -
 104
104 -
 105
105 -
 106
106 -
 107
107 -
 108
108 -
 109
109 -
110
-
111
-
112
-
113
-
114
-
115
-
116
-
117
-
118
-
119
-
120
 |
 |

GROUP FINANCIAL
STATEMENTS
Notes to the Group financial statements 97
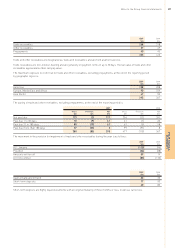
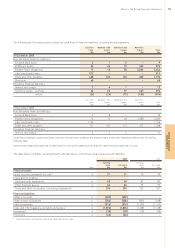
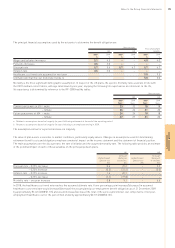
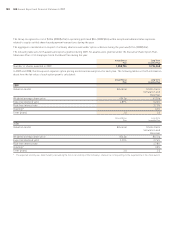
25 Retirement benefits continued
The combined assets of the principal plans and expected rate of return are:
2009 2008
Long-term Long-term
rate of return rate of return
expected Value expected Value
%$m %$m
UK pension plans
Liability matching investment funds 4.8 196 3.9 192
Equities 9.2 77 7.9 87
Bonds 4.8 64 3.9 140
Cash 4.8 55 3.9 4
Other 9.2 34 7.9 14
Total market value of assets 426 437
US pension plans
Equities 9.5 63 9.5 55
Fixed income 5.5 42 5.5 37
Total market value of assets 105 92
The expected rate of return on assets has been determined following advice from the plans’ independent actuaries and is based
on the expected return on each asset class together with consideration of the long-term asset strategy.
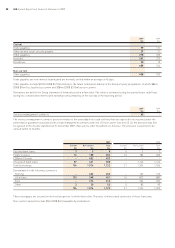
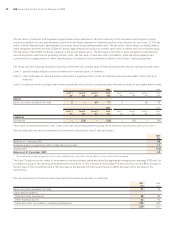
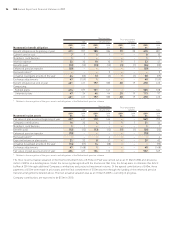
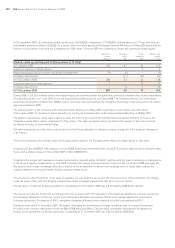
2009 2008 2007 2006 2005
History of experience gains and losses $m $m $m $m $m
UK pension plans
Fair value of plan assets 426 437 611 527 431
Present value of benefit obligations (461) (411) (597) (585) (473)
(Deficit)/surplus in the plans (35) 26 14 (58) (42)
Experience adjustments arising on plan liabilities (44) 55 31 (22) (122)
Experience adjustments arising on plan assets (14) (57) (6) 13 86
US and other pension plans
Fair value of plan assets 126 112 144 111 106
Present value of benefit obligations (197) (185) (184) (175) (176)
Deficit in the plans (71) (73) (40) (64) (70)
Experience adjustments arising on plan liabilities (13) 3––(5)
Experience adjustments arising on plan assets 14 (38) – 4 (2)
US post-employment benefits
Present value of benefit obligations (20) (19) (20) (19) (20)
Experience adjustments arising on plan liabilities (1) 1–11
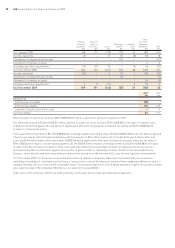
The cumulative amount of net actuarial losses recognised since 1 January 2004 in the Group statement of comprehensive income is $208m
(2008 $150m). The Group is unable to determine how much of the pension scheme deficit recognised on transition to IFRS of $298m and
taken directly to total equity is attributable to actuarial gains and losses since inception of the schemes. Therefore, the Group is unable to
determine the amount of actuarial gains and losses that would have been recognised in the Group statement of comprehensive income
before 1 January 2004.