Holiday Inn 2009 Annual Report Download - page 66
Download and view the complete annual report
Please find page 66 of the 2009 Holiday Inn annual report below. You can navigate through the pages in the report by either clicking on the pages listed below, or by using the keyword search tool below to find specific information within the annual report.-
 1
1 -
2
-
3
-
4
-
5
-
6
-
7
-
8
-
9
-
10
-
11
-
12
-
13
-
14
-
15
-
16
-
17
-
18
-
19
-
20
-
21
-
22
-
23
-
24
-
25
-
26
-
27
-
28
-
29
-
30
-
31
-
32
-
33
-
34
-
35
-
36
-
37
-
38
-
39
-
40
-
41
-
42
-
43
-
44
-
45
-
46
-
47
-
48
-
49
-
50
-
51
-
52
-
53
-
54
-
55
-
 56
56 -
 57
57 -
 58
58 -
 59
59 -
 60
60 -
 61
61 -
 62
62 -
 63
63 -
 64
64 -
 65
65 -
 66
66 -
 67
67 -
 68
68 -
 69
69 -
 70
70 -
 71
71 -
 72
72 -
 73
73 -
 74
74 -
 75
75 -
 76
76 -
77
-
78
-
79
-
80
-
81
-
82
-
83
-
84
-
85
-
86
-
87
-
88
-
89
-
90
-
91
-
92
-
93
-
94
-
95
-
96
-
97
-
98
-
99
-
100
-
101
-
102
-
103
-
104
-
105
-
106
-
107
-
108
-
109
-
110
-
111
-
112
-
113
-
114
-
115
-
116
-
117
-
118
-
119
-
120
 |
 |

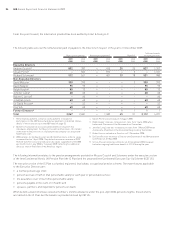
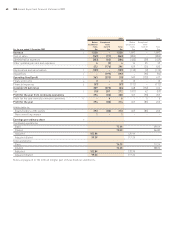
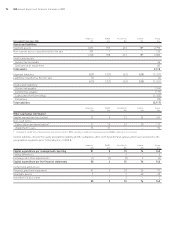
64 IHG Annual Report and Financial Statements 2009
Group statement of cash flows
2009 2008
For the year ended 31 December 2009 $m $m
Profit for the year 214 262
Adjustments for:
Net financial expenses 54 101
Income tax (credit)/charge (272) 59
Depreciation and amortisation 109 112
Impairment 197 96
Other exceptional operating items 176 34
Gain on disposal of assets, net of tax (6) (5)
Equity-settled share-based cost, net of payments 14 31
Other items 13
Operating cash flow before movements in working capital 487 693
Decrease in trade and other receivables 58 42
Increase in trade and other payables 181
Retirement benefit contributions, net of cost (2) (27)
Cash flows relating to exceptional operating items (60) (49)
Cash flow from operations 484 740
Interest paid (53) (112)
Interest received 212
Tax (paid)/received on operating activities (1) 1
Net cash from operating activities 432 641
Cash flow from investing activities
Purchases of property, plant and equipment (100) (53)
Purchases of intangible assets (33) (49)
Investment in associates and other financial assets (15) (6)
Disposal of assets, net of costs and cash disposed of 20 25
Proceeds from associates and other financial assets 15 61
Tax paid on disposals (1) (3)
Net cash from investing activities (114) (25)
Cash flow from financing activities
Proceeds from the issue of share capital 11 2
Purchase of own shares –(139)
Purchase of own shares by employee share trusts (8) (22)
Proceeds on release of own shares by employee share trusts 22
Dividends paid to shareholders (118) (118)
Issue of £250m 6% bonds 411 –
Decrease in other borrowings (660) (316)
Net cash from financing activities (362) (591)
Net movement in cash and cash equivalents in the year (44) 25
Cash and cash equivalents at beginning of the year 82 105
Exchange rate effects 2(48)
Cash and cash equivalents at end of the year 40 82
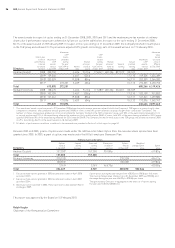
Notes on pages 65 to 104 form an integral part of these financial statements.
Group financial statements continued