Holiday Inn 2009 Annual Report Download - page 53
Download and view the complete annual report
Please find page 53 of the 2009 Holiday Inn annual report below. You can navigate through the pages in the report by either clicking on the pages listed below, or by using the keyword search tool below to find specific information within the annual report.-
 1
1 -
2
-
3
-
4
-
5
-
6
-
7
-
8
-
9
-
10
-
11
-
12
-
13
-
14
-
15
-
16
-
17
-
18
-
19
-
20
-
21
-
22
-
23
-
24
-
25
-
26
-
27
-
28
-
29
-
30
-
31
-
32
-
33
-
34
-
35
-
36
-
37
-
38
-
39
-
40
-
41
-
42
-
 43
43 -
 44
44 -
 45
45 -
 46
46 -
 47
47 -
 48
48 -
 49
49 -
 50
50 -
 51
51 -
 52
52 -
 53
53 -
 54
54 -
 55
55 -
 56
56 -
 57
57 -
 58
58 -
 59
59 -
 60
60 -
 61
61 -
 62
62 -
 63
63 -
64
-
65
-
66
-
67
-
68
-
69
-
70
-
71
-
72
-
73
-
74
-
75
-
76
-
77
-
78
-
79
-
80
-
81
-
82
-
83
-
84
-
85
-
86
-
87
-
88
-
89
-
90
-
91
-
92
-
93
-
94
-
95
-
96
-
97
-
98
-
99
-
100
-
101
-
102
-
103
-
104
-
105
-
106
-
107
-
108
-
109
-
110
-
111
-
112
-
113
-
114
-
115
-
116
-
117
-
118
-
119
-
120
 |
 |
Remuneration report 51
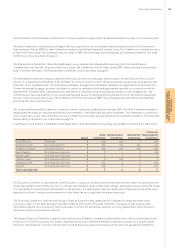
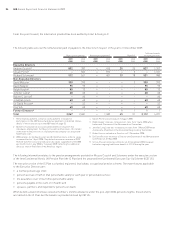
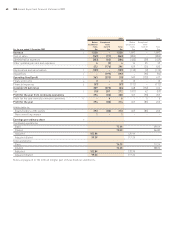
Outcomes in 2009 and progress on all current LTIP cycles
The specific vesting arrangements for all conditional LTIP awards made between 2007 and 2009 are set out in the following table:
Performance Threshold Maximum Threshold1Maximum1Outcome/
measure performance performance vesting vesting current position
2007/2009 LTIP cycle
TSR 5th place in relative 1st place in relative 20% 100% 4th place in relative
comparator group comparator group comparator group
EPS Growth of 10% pa Growth of 20% pa 20% 100% Growth of 15.2% pa
or more
Total vesting 46% of maximum award
2008/2010 LTIP cycle2
TSR Growth equal to Growth exceeds the 20% 100% Growth outperformance
the index index by 8% or more of 12.4%
EPS Growth of 6% pa Growth of 16% pa 20% 100% Growth of 16.4% pa
or more
2009/2011 LTIP cycle3
TSR Growth equal to Growth exceeds the 20% 100% Growth outperformance
the index index by 8% or more of 17.2%
EPS Growth of 0% pa Growth of 10% pa 20% 100% Growth of -1.4% pa
or more
1 Vesting between threshold and maximum occurs on a straight-line basis.
2 Two years of cycle completed.
3 One year of cycle completed.
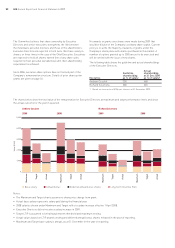
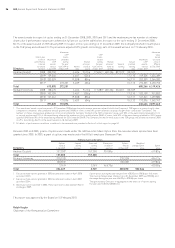
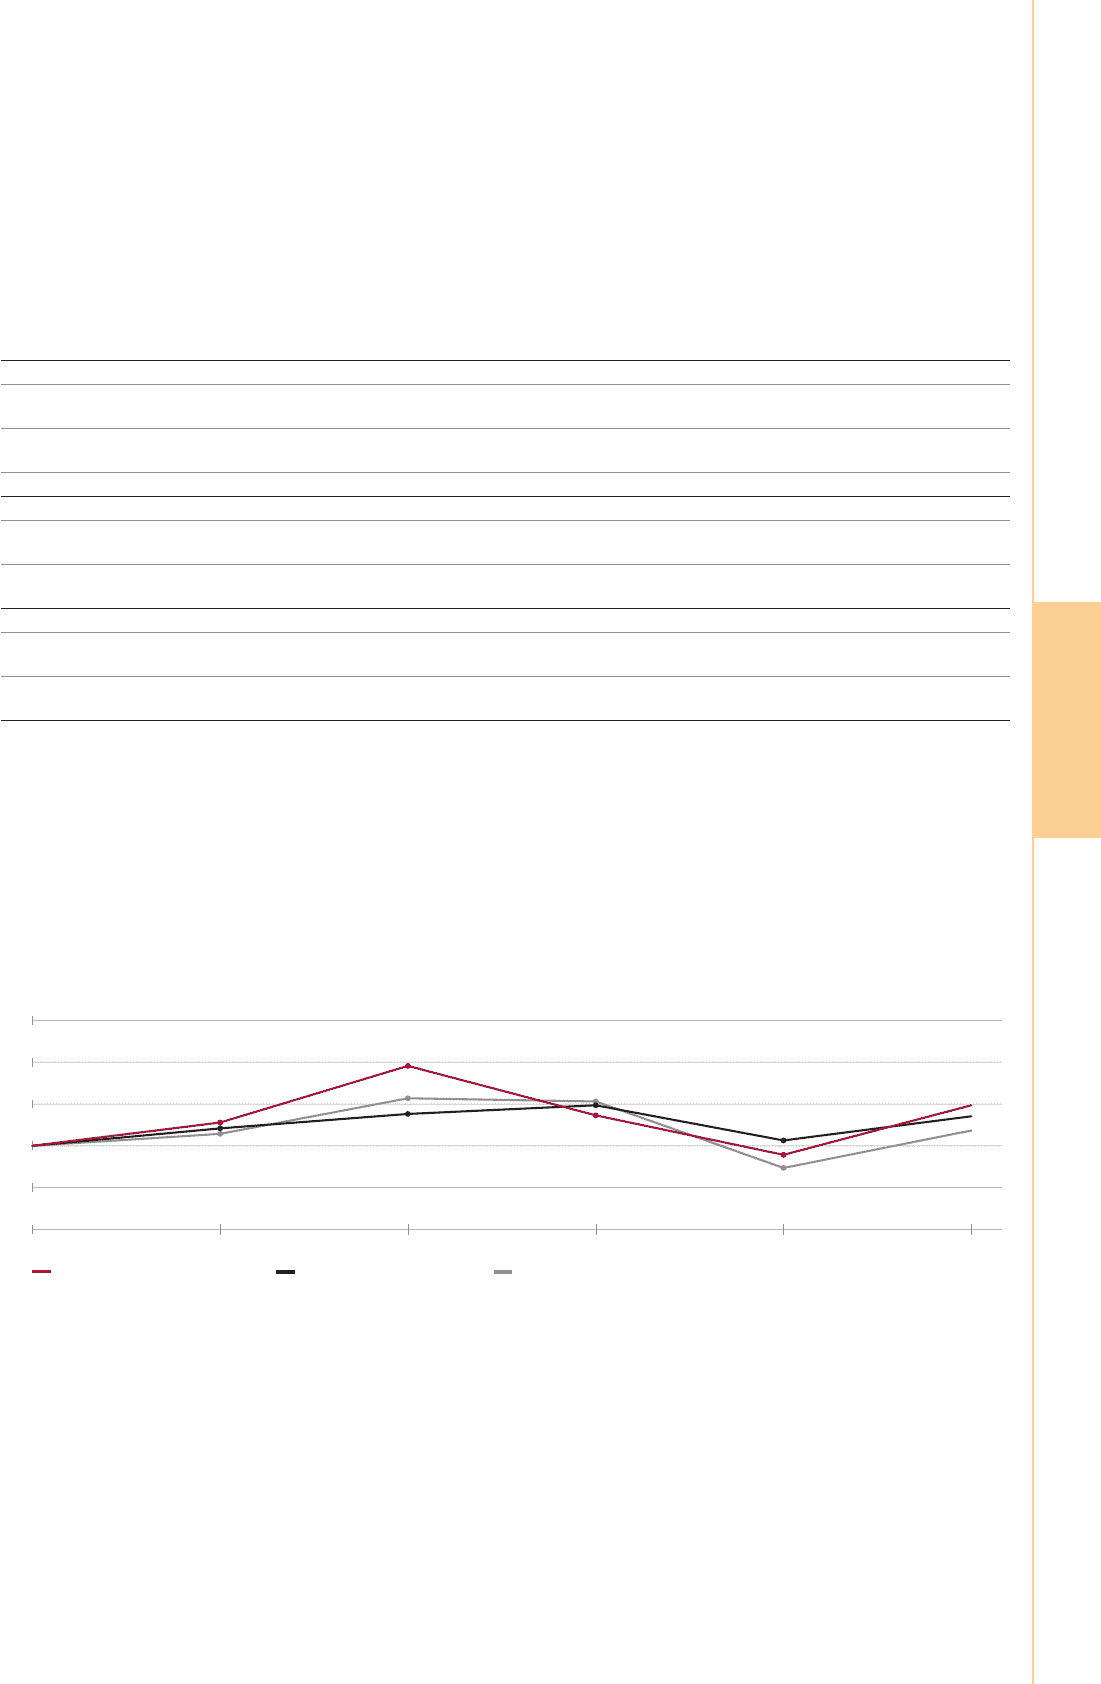
6 Performance graph
Throughout 2009, the Company was a member of the FTSE 100 index and, for remuneration purposes, used a TSR comparator group
of the Dow Jones World Hotels index. Accordingly, the Committee has determined that these are the most appropriate market indices
against which to test the Company’s performance. The graph below shows the TSR performance of IHG from 31 December 2004 to
31 December 2009, assuming dividends are reinvested, compared with the TSR performance achieved by the FTSE 100 index and the
Dow Jones World Hotels index. IHG outperformed both indices over the period.
Total Shareholder Return: InterContinental Hotels Group PLC v FTSE 100 and v Dow Jones World Hotels index
Source: Datastream
InterContinental Hotels Group PLC –
Total Shareholder Return Index
FTSE 100 –
Total Shareholder Return Index
Dow Jones World Hotels –
Total Shareholder Return Index
31 Dec 200931 Dec 200831 Dec 200731 Dec 200631 Dec 200531 Dec 2004
250
200
150
100
50
0
THE BOARD,
SENIOR MANAGEMENT AND
THEIR RESPONSIBILITIES