Holiday Inn 2009 Annual Report Download - page 77
Download and view the complete annual report
Please find page 77 of the 2009 Holiday Inn annual report below. You can navigate through the pages in the report by either clicking on the pages listed below, or by using the keyword search tool below to find specific information within the annual report.-
 1
1 -
2
-
3
-
4
-
5
-
6
-
7
-
8
-
9
-
10
-
11
-
12
-
13
-
14
-
15
-
16
-
17
-
18
-
19
-
20
-
21
-
22
-
23
-
24
-
25
-
26
-
27
-
28
-
29
-
30
-
31
-
32
-
33
-
34
-
35
-
36
-
37
-
38
-
39
-
40
-
41
-
42
-
43
-
44
-
45
-
46
-
47
-
48
-
49
-
50
-
51
-
52
-
53
-
54
-
55
-
56
-
57
-
58
-
59
-
60
-
61
-
62
-
63
-
64
-
65
-
66
-
 67
67 -
 68
68 -
 69
69 -
 70
70 -
 71
71 -
 72
72 -
 73
73 -
 74
74 -
 75
75 -
 76
76 -
 77
77 -
 78
78 -
 79
79 -
 80
80 -
 81
81 -
 82
82 -
 83
83 -
 84
84 -
 85
85 -
 86
86 -
 87
87 -
88
-
89
-
90
-
91
-
92
-
93
-
94
-
95
-
96
-
97
-
98
-
99
-
100
-
101
-
102
-
103
-
104
-
105
-
106
-
107
-
108
-
109
-
110
-
111
-
112
-
113
-
114
-
115
-
116
-
117
-
118
-
119
-
120
 |
 |

GROUP FINANCIAL
STATEMENTS
Notes to the Group financial statements 75
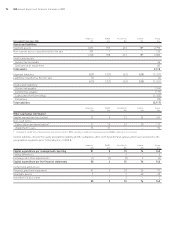
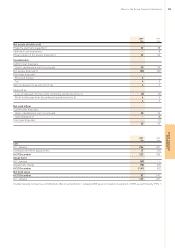
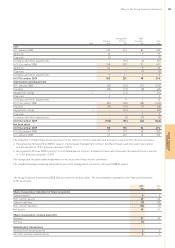
2 Segmental information continued
Year ended Year ended
31 December 31 December
2009 2008
Geographical information $m $m
Revenue
United Kingdom 125 173
United States 678 819
Rest of World 735 905
Total revenue per Group income statement 1,538 1,897
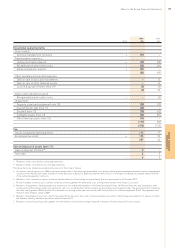
For the purposes of the above table, hotel revenue is determined according to the location of the hotel and other revenue is attributed to the
country of origin. In addition to the United Kingdom, revenue relating to an individual country is separately disclosed when it represents 10%
or more of total revenue.
31 December 31 December
2009 2008
$m $m
Non-current assets
United Kingdom 389 363
United States 805 758
France 376 368
People’s Republic of China 354 357
Rest of World 313 326
Total 2,237 2,172
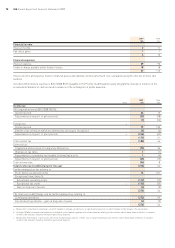
For the purposes of the above table, non-current assets comprise property, plant and equipment, goodwill, intangible assets and
investments in associates. Non-current assets relating to an individual country are separately disclosed when they represent 10%
or more of total non-current assets, as defined above.