Holiday Inn 2009 Annual Report Download - page 73
Download and view the complete annual report
Please find page 73 of the 2009 Holiday Inn annual report below. You can navigate through the pages in the report by either clicking on the pages listed below, or by using the keyword search tool below to find specific information within the annual report.-
 1
1 -
2
-
3
-
4
-
5
-
6
-
7
-
8
-
9
-
10
-
11
-
12
-
13
-
14
-
15
-
16
-
17
-
18
-
19
-
20
-
21
-
22
-
23
-
24
-
25
-
26
-
27
-
28
-
29
-
30
-
31
-
32
-
33
-
34
-
35
-
36
-
37
-
38
-
39
-
40
-
41
-
42
-
43
-
44
-
45
-
46
-
47
-
48
-
49
-
50
-
51
-
52
-
53
-
54
-
55
-
56
-
57
-
58
-
59
-
60
-
61
-
62
-
 63
63 -
 64
64 -
 65
65 -
 66
66 -
 67
67 -
 68
68 -
 69
69 -
 70
70 -
 71
71 -
 72
72 -
 73
73 -
 74
74 -
 75
75 -
 76
76 -
 77
77 -
 78
78 -
 79
79 -
 80
80 -
 81
81 -
 82
82 -
 83
83 -
84
-
85
-
86
-
87
-
88
-
89
-
90
-
91
-
92
-
93
-
94
-
95
-
96
-
97
-
98
-
99
-
100
-
101
-
102
-
103
-
104
-
105
-
106
-
107
-
108
-
109
-
110
-
111
-
112
-
113
-
114
-
115
-
116
-
117
-
118
-
119
-
120
 |
 |
GROUP FINANCIAL
STATEMENTS
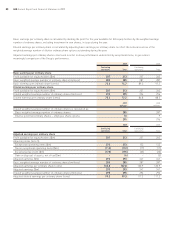
Notes to the Group financial statements 71
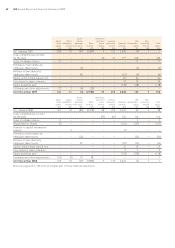
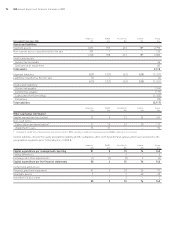
2 Segmental information continued
Americas EMEA Asia Pacific Central Group
Year ended 31 December 2009 $m $m $m $m $m
Revenue
Franchised 437 83 11 – 531
Managed 110 119 105 – 334
Owned and leased 225 195 129 – 549
Central – – – 124 124
Total revenue* 772 397 245 124 1,538
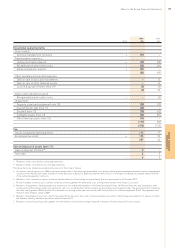
Americas EMEA Asia Pacific Central Group
$m $m $m $m $m
Segmental result
Franchised 364 60 5 – 429
Managed (40) 65 44 – 69
Owned and leased 11 33 30 – 74
Regional and central (47) (31) (27) (104) (209)
Reportable segments’ operating profit 288 127 52 (104) 363
Exceptional operating items (note 5) (301) (22) (7) (43) (373)
Operating loss* (13) 105 45 (147) (10)
Continuing Discontinued Group
$m $m $m
Reportable segments’ operating profit 363 – 363
Exceptional operating items (373) – (373)
Operating loss (10) – (10)
Net finance costs (54) – (54)
Loss before tax (64) – (64)
Tax 272 – 272
Profit after tax 208 – 208
Gain on disposal of assets, net of tax – 6 6
Profit for the year 208 6 214
* Relates to continuing operations.