Holiday Inn 2009 Annual Report Download - page 82
Download and view the complete annual report
Please find page 82 of the 2009 Holiday Inn annual report below. You can navigate through the pages in the report by either clicking on the pages listed below, or by using the keyword search tool below to find specific information within the annual report.-
 1
1 -
2
-
3
-
4
-
5
-
6
-
7
-
8
-
9
-
10
-
11
-
12
-
13
-
14
-
15
-
16
-
17
-
18
-
19
-
20
-
21
-
22
-
23
-
24
-
25
-
26
-
27
-
28
-
29
-
30
-
31
-
32
-
33
-
34
-
35
-
36
-
37
-
38
-
39
-
40
-
41
-
42
-
43
-
44
-
45
-
46
-
47
-
48
-
49
-
50
-
51
-
52
-
53
-
54
-
55
-
56
-
57
-
58
-
59
-
60
-
61
-
62
-
63
-
64
-
65
-
66
-
67
-
68
-
69
-
70
-
71
-
 72
72 -
 73
73 -
 74
74 -
 75
75 -
 76
76 -
 77
77 -
 78
78 -
 79
79 -
 80
80 -
 81
81 -
 82
82 -
 83
83 -
 84
84 -
 85
85 -
 86
86 -
 87
87 -
 88
88 -
 89
89 -
 90
90 -
 91
91 -
 92
92 -
93
-
94
-
95
-
96
-
97
-
98
-
99
-
100
-
101
-
102
-
103
-
104
-
105
-
106
-
107
-
108
-
109
-
110
-
111
-
112
-
113
-
114
-
115
-
116
-
117
-
118
-
119
-
120
 |
 |

80 IHG Annual Report and Financial Statements 2009
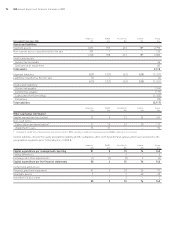
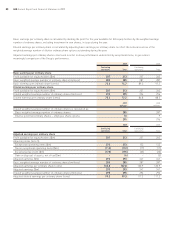
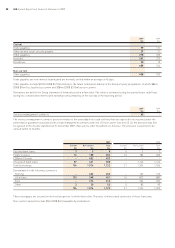
9 Earnings per ordinary share
Basic earnings per ordinary share is calculated by dividing the profit for the year available for IHG equity holders by the weighted average
number of ordinary shares, excluding investment in own shares, in issue during the year.
Diluted earnings per ordinary share is calculated by adjusting basic earnings per ordinary share to reflect the notional exercise of the
weighted average number of dilutive ordinary share options outstanding during the year.
Adjusted earnings per ordinary share is disclosed in order to show performance undistorted by exceptional items, to give a more
meaningful comparison of the Group’s performance.
2009 2008
Continuing Continuing
operations Total operations Total
Basic earnings per ordinary share
Profit available for equity holders ($m) 207 213 257 262
Basic weighted average number of ordinary shares (millions) 285 285 287 287
Basic earnings per ordinary share (cents) 72.6 74.7 89.5 91.3
Diluted earnings per ordinary share
Profit available for equity holders ($m) 207 213 257 262
Diluted weighted average number of ordinary shares (millions) 295 295 296 296
Diluted earnings per ordinary share (cents) 70.2 72.2 86.8 88.5
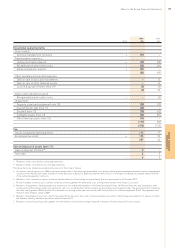
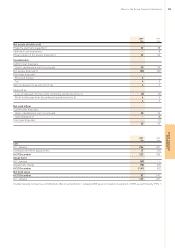
2009 2008
millions millions
Diluted weighted average number of ordinary shares is calculated as:
Basic weighted average number of ordinary shares 285 287
Dilutive potential ordinary shares – employee share options 10 9
295 296
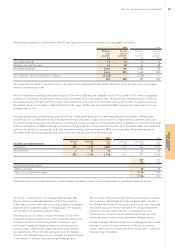
2009 2008
Continuing Continuing
operations Total operations Total
Adjusted earnings per ordinary share
Profit available for equity holders ($m) 207 213 257 262
Adjusting items (note 5):
Exceptional operating items ($m) 373 373 132 132
Tax on exceptional operating items ($m) (112) (112) (17) (17)
Exceptional tax credit ($m) (175) (175) (25) (25)
Gain on disposal of assets, net of tax ($m) –(6)– (5)
Adjusted earnings ($m) 293 293 347 347
Basic weighted average number of ordinary shares (millions) 285 285 287 287
Adjusted earnings per ordinary share (cents) 102.8 102.8 120.9 120.9
Adjusted earnings ($m) 293 293 347 347
Diluted weighted average number of ordinary shares (millions) 295 295 296 296
Adjusted diluted earnings per ordinary share (cents) 99.3 99.3 117.2 117.2
Notes to the Group financial statements continued