Holiday Inn 2009 Annual Report Download - page 20
Download and view the complete annual report
Please find page 20 of the 2009 Holiday Inn annual report below. You can navigate through the pages in the report by either clicking on the pages listed below, or by using the keyword search tool below to find specific information within the annual report.-
 1
1 -
2
-
3
-
4
-
5
-
6
-
7
-
8
-
9
-
 10
10 -
 11
11 -
 12
12 -
 13
13 -
 14
14 -
 15
15 -
 16
16 -
 17
17 -
 18
18 -
 19
19 -
 20
20 -
 21
21 -
 22
22 -
 23
23 -
 24
24 -
 25
25 -
 26
26 -
 27
27 -
 28
28 -
 29
29 -
 30
30 -
31
-
32
-
33
-
34
-
35
-
36
-
37
-
38
-
39
-
40
-
41
-
42
-
43
-
44
-
45
-
46
-
47
-
48
-
49
-
50
-
51
-
52
-
53
-
54
-
55
-
56
-
57
-
58
-
59
-
60
-
61
-
62
-
63
-
64
-
65
-
66
-
67
-
68
-
69
-
70
-
71
-
72
-
73
-
74
-
75
-
76
-
77
-
78
-
79
-
80
-
81
-
82
-
83
-
84
-
85
-
86
-
87
-
88
-
89
-
90
-
91
-
92
-
93
-
94
-
95
-
96
-
97
-
98
-
99
-
100
-
101
-
102
-
103
-
104
-
105
-
106
-
107
-
108
-
109
-
110
-
111
-
112
-
113
-
114
-
115
-
116
-
117
-
118
-
119
-
120
 |
 |

18 IHG Annual Report and Financial Statements 2009
Business review continued
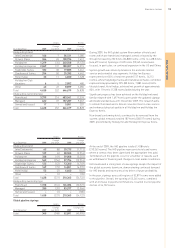
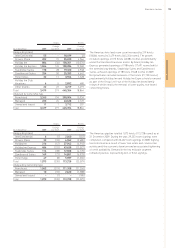
Asia Pacific results
Asia Pacific
Asia Pacific strategic role 2010 priorities
12 months ended 31 December
2009 2008 %
$m $m change
Revenue
Franchised 11 18 (38.9)
Managed 105 113 (7.1)
Owned and leased 129 159 (18.9)
Total 245 290 (15.5)
Operating profit before exceptional items
Franchised 58 (37.5)
Managed 44 55 (20.0)
Owned and leased 30 43 (30.2)
79 106 (25.5)
Regional overheads (27) (38) 28.9
Total 52 68 (23.5)
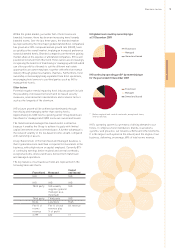
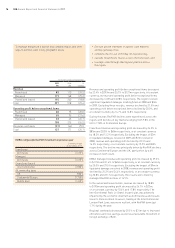
Asia Pacific comparable RevPAR movement on previous year
12 months ended
31 December 2009
Managed – all brands
Asia Pacific (12.5)%
Greater China (15.6)%
Owned and leased
InterContinental (22.2)%
All ownership types
Greater China (16.9)%
Asia Pacific revenue and operating profit before exceptional items
decreased by 15.5% to $245m and 23.5% to $52m respectively.
Excluding the receipt of $4m in significant liquidated damages in
2008, revenue and operating profit declined by 14.3% and 18.8%
respectively. Despite RevPAR declines of 13.5%, the region’s brands
demonstrated outperformance relative to the market.
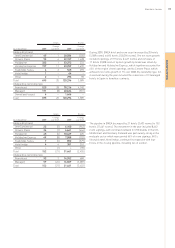
Franchised revenues and operating profit decreased by 38.9% to
$11m and 37.5% to $5m respectively. Excluding the impact of $4m
in liquidated damages received in 2008, revenue decreased by
21.4% and profit increased by $1m or 25.0%. The decline in revenue
was driven by lower RevPAR and the loss of royalties following the
removal of six hotels (1,067 rooms) which did not meet IHG’s brand
and quality standards.
Managed revenue decreased by 7.1% to $105m and operating
profit decreased by 20.0% to $44m. RevPAR across the Greater
China managed estate declined by 15.6%, primarily due to room
oversupply in key Chinese cities, such as Beijing, and trading
upside in 2008 from the Olympic Games.
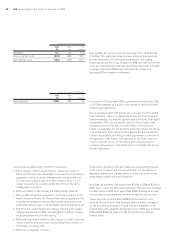
In the owned and leased estate, revenue decreased by 18.9% to
$129m and operating profit decreased by 30.2% to $30m. These
results were driven by the InterContinental Hong Kong, where
RevPAR declined by 22.2% during the year.
Regional overheads decreased by 28.9% to $27m, due to the
impact of regional restructuring and lower marketing costs
associated with the All Nippon Airways joint venture in Japan.
•Complete the roll-out of Holiday Inn repositioning;
•cascade Great Hotels Guests Love to the hotel level; and
•focus on key profit-generating hotels and cities around
the region.
To drive profitable growth in emerging key markets and cities.