GE 2005 Annual Report Download - page 76
Download and view the complete annual report
Please find page 76 of the 2005 GE annual report below. You can navigate through the pages in the report by either clicking on the pages listed below, or by using the keyword search tool below to find specific information within the annual report.-
 1
1 -
2
-
3
-
4
-
5
-
6
-
7
-
8
-
9
-
10
-
11
-
12
-
13
-
14
-
15
-
16
-
17
-
18
-
19
-
20
-
21
-
22
-
23
-
24
-
25
-
26
-
27
-
28
-
29
-
30
-
31
-
32
-
33
-
34
-
35
-
36
-
37
-
38
-
39
-
40
-
41
-
42
-
43
-
44
-
45
-
46
-
47
-
48
-
49
-
50
-
51
-
52
-
53
-
54
-
55
-
56
-
57
-
58
-
59
-
60
-
61
-
62
-
63
-
64
-
65
-
 66
66 -
 67
67 -
 68
68 -
 69
69 -
 70
70 -
 71
71 -
 72
72 -
 73
73 -
 74
74 -
 75
75 -
 76
76 -
 77
77 -
 78
78 -
 79
79 -
 80
80 -
 81
81 -
 82
82 -
 83
83 -
 84
84 -
 85
85 -
 86
86 -
87
-
88
-
89
-
90
-
91
-
92
-
93
-
94
-
95
-
96
-
97
-
98
-
99
-
100
-
101
-
102
-
103
-
104
-
105
-
106
-
107
-
108
-
109
-
110
-
111
-
112
-
113
-
114
-
115
-
116
-
117
-
118
-
119
-
120
-
121
-
122
-
123
-
124
-
125
-
126
-
127
-
128
-
129
-
130
-
131
-
132
-
133
-
134
-
135
-
136
-
137
-
138
-
139
-
140
-
141
-
142
-
143
-
144
-
145
-
146
-
147
-
148
-
149
-
150
-
151
-
152
-
153
-
154
-
155
-
156
-
157
-
158
-
159
-
160
-
161
-
162
-
163
-
164
 |
 |

(76)
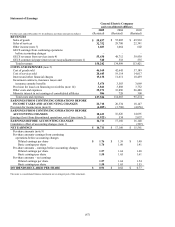
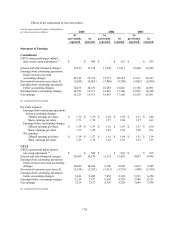
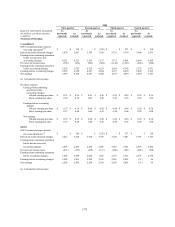
For the years ended December 31(In millions) 2005 2004 2003
As
previously
reported
As
restated
As
previously
reported
As
restated
As
previously
reported
As
restated
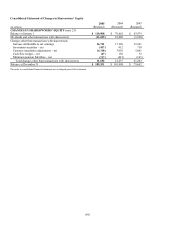
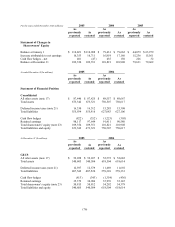
Statement of Changes in
Shareowners’ Equity
Balance at January 1 $ 110,821 $ 110,908 $ 79,631 $ 79,662 $ 64,079 $ 63,979
Increase attributable to net earnings 16,353 16,711 16,819 17,160 15,236 15,561
Cash flow hedges – net 401 (47) 435 150 226 32
Balance at December 31 109,354 109,351 110,821 110,908 79,631 79,662
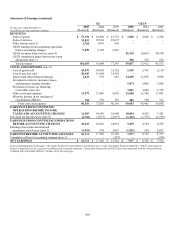
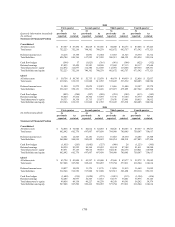
At ended December 31(In millions) 2005 2004
As
previously
reported
As
restated
As
previously
reported
As
restated
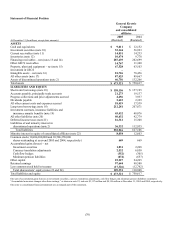
Statement of Financial Position
Consolidated
All other assets (note 17) $ 87,446 $ 87,425 $ 89,557 $ 89,667
Total assets 673,342 673,321 750,507 750,617
Deferred income taxes (note 21) 16,330 16,312 15,285 15,308
Total liabilities 555,934 555,916 627,083 627,106
Cash flow hedges (822) (352) (1,223) (305)
Retained earnings 98,117 97,644 91,411 90,580
Total shareowners’ equity (note 23) 109,354 109,351 110,821 110,908
Total liabilities and equity 673,342 673,321 750,507 750,617
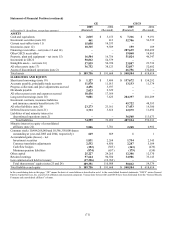
At December 31 (In millions) 2005 2004
As
previously
reported
As
restated
As
previously
reported
As
restated
GECS
All other assets (note 17) $ 52,058 $ 52,037 $ 52,572 $ 52,682
Total assets 540,605 540,584 618,504 618,614
Deferred income taxes (note 21) 12,597 12,579 11,669 11,692
Total liabilities 487,542 487,524 559,310 559,333
Cash flow hedges (813) (343) (1,354) (436)
Retained earnings 35,379 34,906 35,976 35,145
Total shareowner’ s equity (note 23) 50,815 50,812 54,292 54,379
Total liabilities and equity 540,605 540,584 618,504 618,614