GE 2005 Annual Report Download - page 100
Download and view the complete annual report
Please find page 100 of the 2005 GE annual report below. You can navigate through the pages in the report by either clicking on the pages listed below, or by using the keyword search tool below to find specific information within the annual report.-
 1
1 -
2
-
3
-
4
-
5
-
6
-
7
-
8
-
9
-
10
-
11
-
12
-
13
-
14
-
15
-
16
-
17
-
18
-
19
-
20
-
21
-
22
-
23
-
24
-
25
-
26
-
27
-
28
-
29
-
30
-
31
-
32
-
33
-
34
-
35
-
36
-
37
-
38
-
39
-
40
-
41
-
42
-
43
-
44
-
45
-
46
-
47
-
48
-
49
-
50
-
51
-
52
-
53
-
54
-
55
-
56
-
57
-
58
-
59
-
60
-
61
-
62
-
63
-
64
-
65
-
66
-
67
-
68
-
69
-
70
-
71
-
72
-
73
-
74
-
75
-
76
-
77
-
78
-
79
-
80
-
81
-
82
-
83
-
84
-
85
-
86
-
87
-
88
-
89
-
 90
90 -
 91
91 -
 92
92 -
 93
93 -
 94
94 -
 95
95 -
 96
96 -
 97
97 -
 98
98 -
 99
99 -
 100
100 -
 101
101 -
 102
102 -
 103
103 -
 104
104 -
 105
105 -
 106
106 -
 107
107 -
 108
108 -
 109
109 -
 110
110 -
111
-
112
-
113
-
114
-
115
-
116
-
117
-
118
-
119
-
120
-
121
-
122
-
123
-
124
-
125
-
126
-
127
-
128
-
129
-
130
-
131
-
132
-
133
-
134
-
135
-
136
-
137
-
138
-
139
-
140
-
141
-
142
-
143
-
144
-
145
-
146
-
147
-
148
-
149
-
150
-
151
-
152
-
153
-
154
-
155
-
156
-
157
-
158
-
159
-
160
-
161
-
162
-
163
-
164
 |
 |

(100)
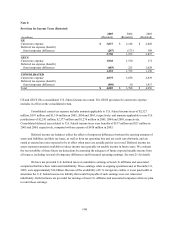
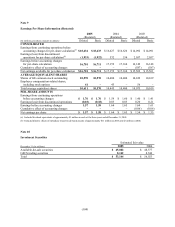
Note 9
Earnings Per Share Information (Restated)
2005
(Restated)
2004
(Restated)
2003
(Restated)
(In millions; per-share amounts in dollars) Diluted Basic Diluted Basic Diluted Basic
CONSOLIDATED
Earnings from continuing operations before
accounting changes for per–share calculation(a) $18,634 $18,633 $ 16,627 $ 16,626 $ 14,092 $ 14,091
Earnings (loss) from discontinued
operations for per-share calculation(b)
(1,933) (1,922) 532 534 2,057 2,057
Earnings before accounting changes
for per–share calculation
16,701
16,711 17,159 17,160 16,149 16,148
Cumulative effect of accounting changes –
–
–
–
(587 ) (587)
Net earnings available for per-share calculation $16,701 $16,711 $ 17,159 $ 17,160 $ 15,562 $ 15,561
AVERAGE EQUIVALENT SHARES
Shares of GE common stock outstanding 10,570
10,570 10,400 10,400 10,019 10,019
Employee compensation-related shares,
including stock options 41
–
45
–
56
–
Total average equivalent shares 10,611
10,570 10,445 10,400 10,075 10,019
PER–SHARE AMOUNTS
Earnings from continuing operations
before accounting changes $1.76 $1.76 $ 1.59 $ 1.60 $ 1.40 $ 1.41
Earnings (loss) from discontinued operations (0.18) (0.18) 0.05 0.05 0.20 0.21
Earnings before accounting changes 1.57 1.58 1.64 1.65 1.60 1.61
Cumulative effect of accounting changes –
–
–
–
(0.06 ) (0.06)
Net earnings per share $1.57 $1.58 $ 1.64 $ 1.65 $ 1.54 $ 1.55
(a) Included dividend equivalents of approximately $1 million in each of the three years ended December 31, 2005.
(b) Included dilutive effects of subsidiary-issued stock-based awards of approximately $11 million in 2005 and $2 million in 2004.
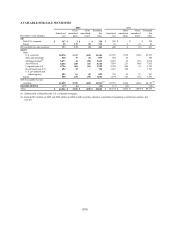
Note 10
Investment Securities
Estimated fair value
December 31 (In millions) 2005
2004
Available-for-sale securities $ 45,002 $ 48,577
GECS trading securities 8,142 8,346
Total $ 53,144 $ 56,923