GE 2005 Annual Report Download - page 63
Download and view the complete annual report
Please find page 63 of the 2005 GE annual report below. You can navigate through the pages in the report by either clicking on the pages listed below, or by using the keyword search tool below to find specific information within the annual report.-
 1
1 -
2
-
3
-
4
-
5
-
6
-
7
-
8
-
9
-
10
-
11
-
12
-
13
-
14
-
15
-
16
-
17
-
18
-
19
-
20
-
21
-
22
-
23
-
24
-
25
-
26
-
27
-
28
-
29
-
30
-
31
-
32
-
33
-
34
-
35
-
36
-
37
-
38
-
39
-
40
-
41
-
42
-
43
-
44
-
45
-
46
-
47
-
48
-
49
-
50
-
51
-
52
-
 53
53 -
 54
54 -
 55
55 -
 56
56 -
 57
57 -
 58
58 -
 59
59 -
 60
60 -
 61
61 -
 62
62 -
 63
63 -
 64
64 -
 65
65 -
 66
66 -
 67
67 -
 68
68 -
 69
69 -
 70
70 -
 71
71 -
 72
72 -
 73
73 -
74
-
75
-
76
-
77
-
78
-
79
-
80
-
81
-
82
-
83
-
84
-
85
-
86
-
87
-
88
-
89
-
90
-
91
-
92
-
93
-
94
-
95
-
96
-
97
-
98
-
99
-
100
-
101
-
102
-
103
-
104
-
105
-
106
-
107
-
108
-
109
-
110
-
111
-
112
-
113
-
114
-
115
-
116
-
117
-
118
-
119
-
120
-
121
-
122
-
123
-
124
-
125
-
126
-
127
-
128
-
129
-
130
-
131
-
132
-
133
-
134
-
135
-
136
-
137
-
138
-
139
-
140
-
141
-
142
-
143
-
144
-
145
-
146
-
147
-
148
-
149
-
150
-
151
-
152
-
153
-
154
-
155
-
156
-
157
-
158
-
159
-
160
-
161
-
162
-
163
-
164
 |
 |

(63)
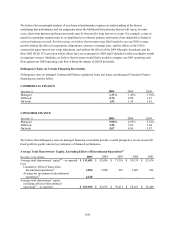
• Delinquency rates on certain financing receivables of the Commercial Finance and Consumer Finance segments
for 2005, 2004 and 2003
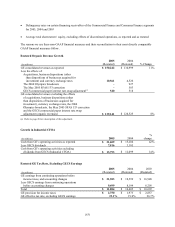
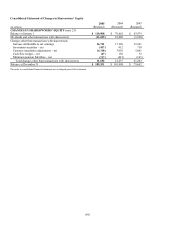
• Average total shareowners’ equity, excluding effects of discontinued operations, as reported and as restated
The reasons we use these non-GAAP financial measures and their reconciliation to their most directly comparable
GAAP financial measures follow.
Restated Organic Revenue Growth
(In millions)
2005
(Restated)
2004
(Restated) % Change
GE consolidated revenues as reported $150,242
$ 134,999 11%
Less the effects of:
Acquisitions, business dispositions (other
than dispositions of businesses acquired for
investment) and currency exchange rates 10,561 4,526
The 2004 Olympics broadcasts – 927
The May 2005 SFAS 133 correction – 503
GECS commercial paper interest rate swap adjustment(a) 540 518
GE consolidated revenues excluding the effects
of acquisitions, business dispositions (other
than dispositions of businesses acquired for
investment), currency exchange rates, the 2004
Olympics broadcasts, the May 2005 SFAS 133 correction
and the GECS commercial paper interest rate swap
adjustment (organic revenues) $139,141
$ 128,525 8%
(a) Refer to page 28 for a description of this adjustment.
Growth in Industrial CFOA
(In millions) 2005 2004
%
change
Cash from GE’ s operating activities as reported $21,609 $ 15,204 42%
Less GECS dividends 7,816 3,105
Cash from GE’ s operating activities excluding
dividends from GECS (Industrial CFOA) $13,793 $ 12,099 14%
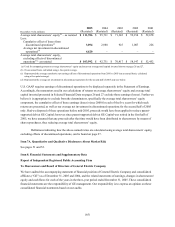
Restated GE Tax Rate, Excluding GECS Earnings
(In millions)
2005
(Restated)
2004
(Restated)
2003
(Restated)
GE earnings from continuing operations before
income taxes, and accounting changes $21,383 $ 18,599 $ 16,948
Less GECS earnings from continuing operations
before accounting changes 9,499 8,194 6,256
Total $11,884 $ 10,405 $ 10,692
GE provision for income taxes $2,750 $ 1,973 $ 2,857
GE effective tax rate, excluding GECS earnings 23.1% 19.0 % 26.7 %