GE 2005 Annual Report Download - page 40
Download and view the complete annual report
Please find page 40 of the 2005 GE annual report below. You can navigate through the pages in the report by either clicking on the pages listed below, or by using the keyword search tool below to find specific information within the annual report.-
 1
1 -
2
-
3
-
4
-
5
-
6
-
7
-
8
-
9
-
10
-
11
-
12
-
13
-
14
-
15
-
16
-
17
-
18
-
19
-
20
-
21
-
22
-
23
-
24
-
25
-
26
-
27
-
28
-
29
-
 30
30 -
 31
31 -
 32
32 -
 33
33 -
 34
34 -
 35
35 -
 36
36 -
 37
37 -
 38
38 -
 39
39 -
 40
40 -
 41
41 -
 42
42 -
 43
43 -
 44
44 -
 45
45 -
 46
46 -
 47
47 -
 48
48 -
 49
49 -
 50
50 -
51
-
52
-
53
-
54
-
55
-
56
-
57
-
58
-
59
-
60
-
61
-
62
-
63
-
64
-
65
-
66
-
67
-
68
-
69
-
70
-
71
-
72
-
73
-
74
-
75
-
76
-
77
-
78
-
79
-
80
-
81
-
82
-
83
-
84
-
85
-
86
-
87
-
88
-
89
-
90
-
91
-
92
-
93
-
94
-
95
-
96
-
97
-
98
-
99
-
100
-
101
-
102
-
103
-
104
-
105
-
106
-
107
-
108
-
109
-
110
-
111
-
112
-
113
-
114
-
115
-
116
-
117
-
118
-
119
-
120
-
121
-
122
-
123
-
124
-
125
-
126
-
127
-
128
-
129
-
130
-
131
-
132
-
133
-
134
-
135
-
136
-
137
-
138
-
139
-
140
-
141
-
142
-
143
-
144
-
145
-
146
-
147
-
148
-
149
-
150
-
151
-
152
-
153
-
154
-
155
-
156
-
157
-
158
-
159
-
160
-
161
-
162
-
163
-
164
 |
 |

(40)
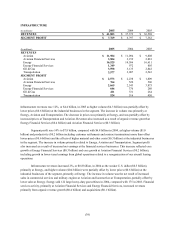
Segment profit fell 8%, or $0.6 billion, in 2004 as lower material costs ($0.3 billion), primarily at Energy,
and higher volume ($0.1 billion) were more than offset by lower prices ($0.6 billion) and lower productivity ($0.6
billion) at the industrial businesses of the segment. The lower productivity was the net effect of lower productivity at
Energy, primarily from the anticipated decline in higher margin gas turbine sales and a decrease in customer
contract termination fees, partially offset by higher productivity at Aviation. Segment profit from the financial
services businesses, primarily Energy Financial Services, increased $0.1 billion as a result of core growth.
Infrastructure orders were $38.4 billion in 2005, up from $34.0 billion in 2004. The $29.2 billion total
backlog at year-end 2005 comprised unfilled product orders of $18.8 billion (of which 65% was scheduled for
delivery in 2006) and product service orders of $10.4 billion scheduled for 2006 delivery. Comparable December
31, 2004, total backlog was $27.8 billion, of which $18.2 billion was for unfilled product orders and $9.6 billion for
product services orders.
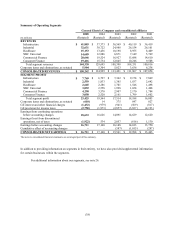
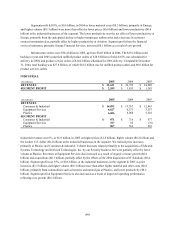
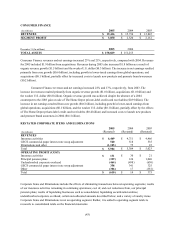
INDUSTRIAL
(In millions) 2005 2004 2003
REVENUES $32,631 $ 30,722 $ 24,988
SEGMENT PROFIT $2,559 $1,833 $1,385
(In millions) 2005 2004 2003
REVENUES
Consumer & Industrial $14,092 $ 13,767 $ 12,843
Equipment Services 6,627 6,571 3,357
Plastics 6,606 6,066 5,501
SEGMENT PROFIT
Consumer & Industrial $871 $716 $577
Equipment Services 197 82 (76)
Plastics 867 566 503
Industrial revenues rose 6%, or $1.9 billion, in 2005 on higher prices ($1.5 billion), higher volume ($0.2 billion) and
the weaker U.S. dollar ($0.2 billion) at the industrial businesses in the segment. We realized price increases
primarily at Plastics and Consumer & Industrial. Volume increases related primarily to the acquisitions of Edwards
Systems Technology and InVision Technologies, Inc. by our Security business, but were partially offset by lower
volume at Plastics. Revenues at Equipment Services also increased as a result of organic revenue growth ($0.4
billion) and acquisitions ($0.1 billion), partially offset by the effects of the 2004 disposition of IT Solutions ($0.4
billion). Segment profit rose 35%, or $0.6 billion, at the industrial businesses in the segment in 2005 as price
increases ($1.5 billion) and higher volume ($0.1 billion) more than offset higher material and other costs ($0.8
billion), primarily from commodities such as benzene and natural gas at Plastics, and lower productivity ($0.2
billion). Segment profit at Equipment Services also increased as a result of improved operating performance,
reflecting core growth ($0.1 billion).