GE 2005 Annual Report Download - page 73
Download and view the complete annual report
Please find page 73 of the 2005 GE annual report below. You can navigate through the pages in the report by either clicking on the pages listed below, or by using the keyword search tool below to find specific information within the annual report.-
 1
1 -
2
-
3
-
4
-
5
-
6
-
7
-
8
-
9
-
10
-
11
-
12
-
13
-
14
-
15
-
16
-
17
-
18
-
19
-
20
-
21
-
22
-
23
-
24
-
25
-
26
-
27
-
28
-
29
-
30
-
31
-
32
-
33
-
34
-
35
-
36
-
37
-
38
-
39
-
40
-
41
-
42
-
43
-
44
-
45
-
46
-
47
-
48
-
49
-
50
-
51
-
52
-
53
-
54
-
55
-
56
-
57
-
58
-
59
-
60
-
61
-
62
-
 63
63 -
 64
64 -
 65
65 -
 66
66 -
 67
67 -
 68
68 -
 69
69 -
 70
70 -
 71
71 -
 72
72 -
 73
73 -
 74
74 -
 75
75 -
 76
76 -
 77
77 -
 78
78 -
 79
79 -
 80
80 -
 81
81 -
 82
82 -
 83
83 -
84
-
85
-
86
-
87
-
88
-
89
-
90
-
91
-
92
-
93
-
94
-
95
-
96
-
97
-
98
-
99
-
100
-
101
-
102
-
103
-
104
-
105
-
106
-
107
-
108
-
109
-
110
-
111
-
112
-
113
-
114
-
115
-
116
-
117
-
118
-
119
-
120
-
121
-
122
-
123
-
124
-
125
-
126
-
127
-
128
-
129
-
130
-
131
-
132
-
133
-
134
-
135
-
136
-
137
-
138
-
139
-
140
-
141
-
142
-
143
-
144
-
145
-
146
-
147
-
148
-
149
-
150
-
151
-
152
-
153
-
154
-
155
-
156
-
157
-
158
-
159
-
160
-
161
-
162
-
163
-
164
 |
 |
(73)
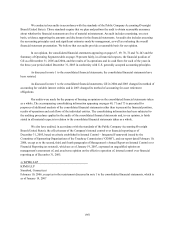
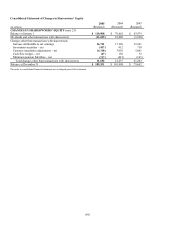
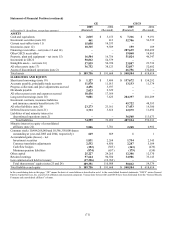
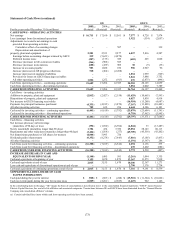
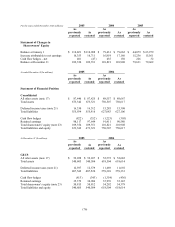
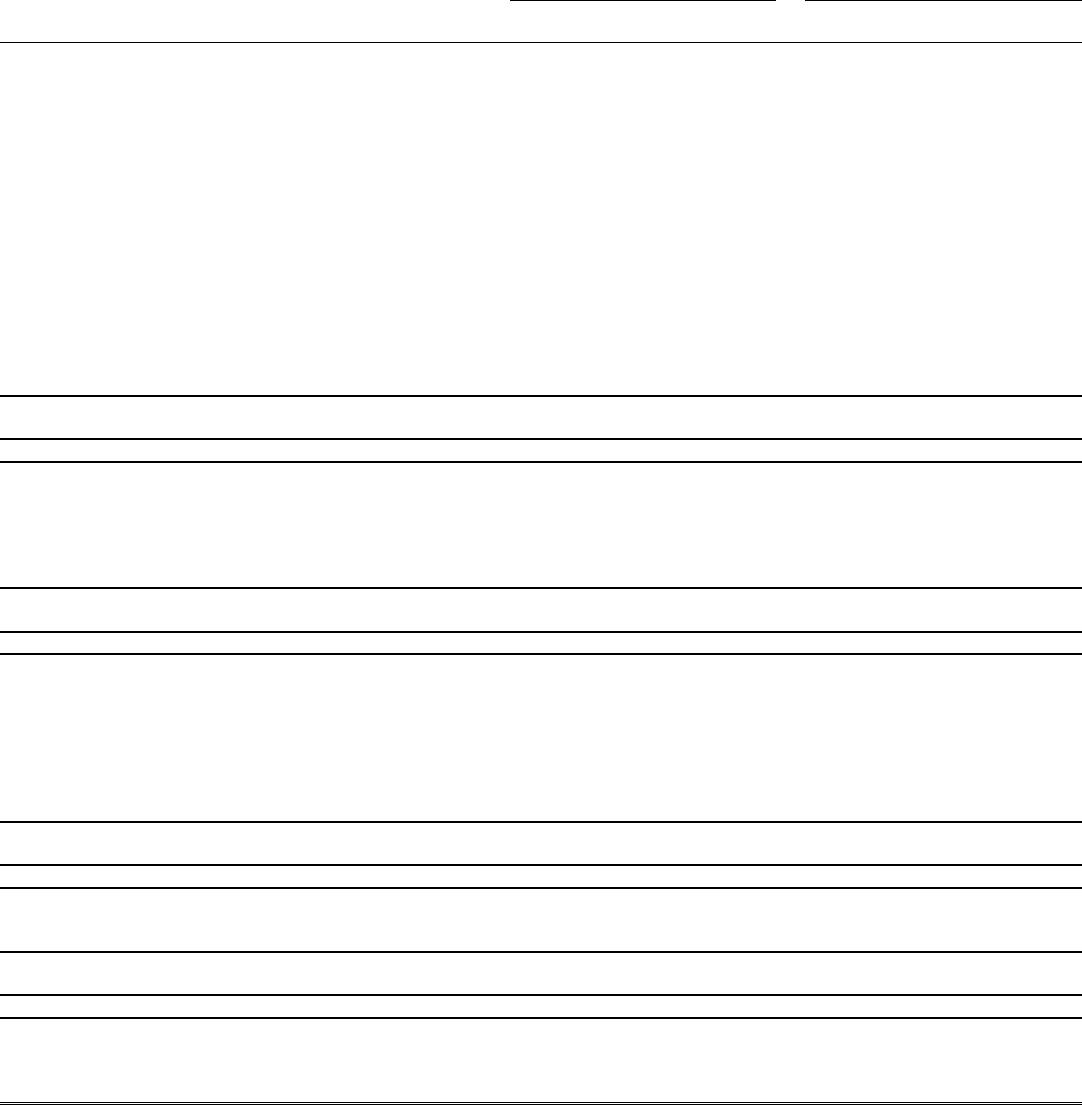
Statement of Cash Flows (continued)
GE GECS
For the years ended December 31 (In millions)
2005
(Restated
(a) 2004
(Restated)
(a) 2003
(Restated)
(a) 2005
(Restated)
(a) 2004
(Restated)
(a) 2003
(Restated)
(a)
CASH FLOWS – OPERATING ACTIVITIES
Net earnings $16,711 $ 17,160 $ 15,561 $ 7,577
$ 8,728 $ 7,974
Loss (earnings) from discontinued operations –
–
–
1,922
(534) (2,057)
Adjustments to reconcile net earnings to cash
provided from operating activities
Cumulative effect of accounting changes –
–
587 –
– 339
Depreciation and amortization of
property, plant and equipment 2,501 2,533 2,277 6,037
5,816 4,587
Earnings before accounting changes retained by GECS 239 (5,623) (4,878) –
– –
Deferred income taxes (287) (175) 389 (603 ) 225 1,028
Decrease (increase) in GE current receivables (266) (908) 585 –
– –
Decrease (increase) in inventories (608) (459) 909 30
(9) (35)
Increase in accounts payable 983 1,888 676 596
2,927 96
Increase (decrease) in GE progress collections 510 (464) (2,268) –
– –
Increase (decrease) in insurance liabilities –
–
–
1,034
1,959 (729)
Provision for losses on GECS financing receivables –
–
–
3,841
3,888 3,752
All other operating activities 1,826 1,252 (913) 476
(2,875) (896)
Cash from operating activities – continuing operations 21,609 15,204 12,925 20,910
20,125 14,059
Cash from operating activities –discontinued operations –
–
–
3,854
6,002 7,389
CASH FROM OPERATING ACTIVITIES 21,609 15,204 12,925 24,764
26,127 21,448
Cash flows – investing activities
Additions to property, plant and equipment (2,812) (2,427) (2,158)
(11,629 ) (10,665) (7,593)
Dispositions of property, plant and equipment –
–
–
6,027
5,838 4,918
Net increase in GECS financing receivables –
–
–
(16,954 ) (15,280) (4,687)
Payments for principal businesses purchased (4,331) (4,815) (3,870) (7,167 ) (13,888) (10,482)
All other investing activities 702 632 236 4,644
8,386 6,103
Cash used for investing activities – continuing operations (6,441) (6,610) (5,792)
(25,079 ) (25,609) (11,741)
Cash used for investing activities – discontinued operations –
–
–
(4,718 ) (7,962) (5,945)
CASH USED FOR INVESTING ACTIVITIES (6,441) (6,610) (5,792)
(29,797 ) (33,571) (17,686)
Cash flows – financing activities
Net increase (decrease) in borrowings
(maturities of 90 days or less) (392 ) (1,690) (6,704) (4,044 ) 33 (13,487)
Newly issued debt (maturities longer than 90 days) 1,704 434 7,356 65,054
58,143 60,113
Repayments and other reductions (maturities longer than 90 days) (3,424) (1,568) (277)
(49,709 ) (45,538) (43,202)
Net dispositions (purchases) of GE shares for treasury (4,844) 3,993 726 –
– –
Dividends paid to shareowners (9,352) (8,278) (7,643) (7,816 ) (3,105) (3,435)
All other financing activities –
–
–
(1,191 ) (3,397) 286
Cash from (used for) financing activities – continuing operations (16,308) (7,109) (6,542) 2,294
6,136 275
Cash from (used for) financing activities – discontinued operations –
–
–
478
2,402 (682)
CASH FROM (USED FOR) FINANCING ACTIVITIES (16,308) (7,109) (6,542) 2,772
8,538 (407)
INCREASE (DECREASE) IN CASH AND
EQUIVALENTS DURING YEAR (1,140) 1,485 591
(2,261 ) 1,094 3,355
Cash and equivalents at beginning of year 3,155 1,670 1,079 12,367
11,273 7,918
Cash and equivalents at end of year 2,015 3,155 1,670 10,106
12,367 11,273
Less cash and equivalents of discontinued operations at end of year –
–
–
2,790
3,176 2,734
Cash and equivalents of continuing operations at end of year $2,015 $ 3,155 $ 1,670 $ 7,316
$ 9,191 $ 8,539
SUPPLEMENTAL DISCLOSURE OF CASH
FLOWS INFORMATION
Cash paid during the year for interest $(928) $ (603) $ (248) $ (15,518 ) $ (11,304) $ (10,662)
Cash recovered (paid) during the year for income taxes (1,829) (2,261) (2,685) (1,425 ) 922 1,146
In the consolidating data on this page, “GE” means the basis of consolidation as described in note 1 to the consolidated financial statements; “GECS” means General
Electric Capital Services, Inc. and all of its affiliates and associated companies. Transactions between GE and GECS have been eliminated from the “General Electric
Company and consolidated affiliates” columns.
(a) Certain individual lines items within cash from operating activities have been restated.