GE 2005 Annual Report Download - page 38
Download and view the complete annual report
Please find page 38 of the 2005 GE annual report below. You can navigate through the pages in the report by either clicking on the pages listed below, or by using the keyword search tool below to find specific information within the annual report.-
 1
1 -
2
-
3
-
4
-
5
-
6
-
7
-
8
-
9
-
10
-
11
-
12
-
13
-
14
-
15
-
16
-
17
-
18
-
19
-
20
-
21
-
22
-
23
-
24
-
25
-
26
-
27
-
 28
28 -
 29
29 -
 30
30 -
 31
31 -
 32
32 -
 33
33 -
 34
34 -
 35
35 -
 36
36 -
 37
37 -
 38
38 -
 39
39 -
 40
40 -
 41
41 -
 42
42 -
 43
43 -
 44
44 -
 45
45 -
 46
46 -
 47
47 -
 48
48 -
49
-
50
-
51
-
52
-
53
-
54
-
55
-
56
-
57
-
58
-
59
-
60
-
61
-
62
-
63
-
64
-
65
-
66
-
67
-
68
-
69
-
70
-
71
-
72
-
73
-
74
-
75
-
76
-
77
-
78
-
79
-
80
-
81
-
82
-
83
-
84
-
85
-
86
-
87
-
88
-
89
-
90
-
91
-
92
-
93
-
94
-
95
-
96
-
97
-
98
-
99
-
100
-
101
-
102
-
103
-
104
-
105
-
106
-
107
-
108
-
109
-
110
-
111
-
112
-
113
-
114
-
115
-
116
-
117
-
118
-
119
-
120
-
121
-
122
-
123
-
124
-
125
-
126
-
127
-
128
-
129
-
130
-
131
-
132
-
133
-
134
-
135
-
136
-
137
-
138
-
139
-
140
-
141
-
142
-
143
-
144
-
145
-
146
-
147
-
148
-
149
-
150
-
151
-
152
-
153
-
154
-
155
-
156
-
157
-
158
-
159
-
160
-
161
-
162
-
163
-
164
 |
 |

(38)
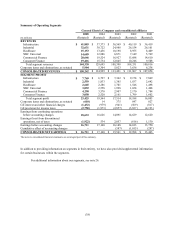
Summary of Operating Segments
General Electric Company and consolidated affiliates
(In millions)
2005
(Restated)
2004
(Restated)
2003
(Restated)
2002
(Restated)
2001
(Restated)
REVENUES
Infrastructure $41,803 $ 37,373 $ 36,569 $ 40,119 $ 36,419
Industrial 32,631 30,722 24,988 26,154 26,101
Healthcare 15,153 13,456 10,198 8,955 8,409
NBC Universal 14,689 12,886 6,871 7,149 5,769
Commercial Finance 20,646 19,524 16,927 15,688 14,610
Consumer Finance 19,416 15,734 12,845 10,266 9,508
Total segment revenues 144,338 129,695 108,398 108,331 100,816
Corporate items and eliminations, as restated 5,904 5,304 5,023 3,636 6,238
CONSOLIDATED REVENUES $150,242 $ 134,999 $ 113,421 $ 111,967 $ 107,054
SEGMENT PROFIT
Infrastructure $7,769 $ 6,797 $ 7,362 $ 9,178 $ 7,869
Industrial 2,559 1,833 1,385 1,837 2,642
Healthcare 2,665 2,286 1,701 1,546 1,498
NBC Universal 3,092 2,558 1,998 1,658 1,408
Commercial Finance 4,290 3,570 2,907 2,170 1,784
Consumer Finance 3,050 2,520 2,161 1,799 1,602
Total segment profit 23,425 19,564 17,514 18,188 16,803
Corporate items and eliminations, as restated (610) 14 375 847 827
GE interest and other financial charges (1,432) (979) (941) (569 ) (817)
GE provision for income taxes (2,750) (1,973) (2,857) (3,837 ) (4,193)
Earnings from continuing operations
before accounting changes 18,633 16,626 14,091 14,629 12,620
Earnings (loss) from discontinued
operations, net of taxes (1,922) 534 2,057 (616 ) 1,130
Earnings before accounting changes 16,711 17,160 16,148 14,013 13,750
Cumulative effect of accounting changes
–
–
(587) (1,015 ) (287)
CONSOLIDATED NET EARNINGS $16,711 $ 17,160 $ 15,561 $ 12,998 $ 13,463
The notes to consolidated financial statements are an integral part of this summary.
In addition to providing information on segments in their entirety, we have also provided supplemental information
for certain businesses within the segments.
For additional information about our segments, see note 26.