GE 2005 Annual Report Download - page 72
Download and view the complete annual report
Please find page 72 of the 2005 GE annual report below. You can navigate through the pages in the report by either clicking on the pages listed below, or by using the keyword search tool below to find specific information within the annual report.-
 1
1 -
2
-
3
-
4
-
5
-
6
-
7
-
8
-
9
-
10
-
11
-
12
-
13
-
14
-
15
-
16
-
17
-
18
-
19
-
20
-
21
-
22
-
23
-
24
-
25
-
26
-
27
-
28
-
29
-
30
-
31
-
32
-
33
-
34
-
35
-
36
-
37
-
38
-
39
-
40
-
41
-
42
-
43
-
44
-
45
-
46
-
47
-
48
-
49
-
50
-
51
-
52
-
53
-
54
-
55
-
56
-
57
-
58
-
59
-
60
-
61
-
 62
62 -
 63
63 -
 64
64 -
 65
65 -
 66
66 -
 67
67 -
 68
68 -
 69
69 -
 70
70 -
 71
71 -
 72
72 -
 73
73 -
 74
74 -
 75
75 -
 76
76 -
 77
77 -
 78
78 -
 79
79 -
 80
80 -
 81
81 -
 82
82 -
83
-
84
-
85
-
86
-
87
-
88
-
89
-
90
-
91
-
92
-
93
-
94
-
95
-
96
-
97
-
98
-
99
-
100
-
101
-
102
-
103
-
104
-
105
-
106
-
107
-
108
-
109
-
110
-
111
-
112
-
113
-
114
-
115
-
116
-
117
-
118
-
119
-
120
-
121
-
122
-
123
-
124
-
125
-
126
-
127
-
128
-
129
-
130
-
131
-
132
-
133
-
134
-
135
-
136
-
137
-
138
-
139
-
140
-
141
-
142
-
143
-
144
-
145
-
146
-
147
-
148
-
149
-
150
-
151
-
152
-
153
-
154
-
155
-
156
-
157
-
158
-
159
-
160
-
161
-
162
-
163
-
164
 |
 |

(72)
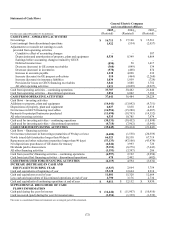
Statement of Cash Flows
General Electric Company
and consolidated affiliates
For the years ended December 31 (In millions)
2005
(Restated)
(a) 2004
(Restated)
(a) 2003
(Restated)
(a)
CASH FLOWS – OPERATING ACTIVITIES
Net earnings $16,711 $ 17,160 $ 15,561
Loss (earnings) from discontinued operations 1,922 (534) (2,057)
Adjustments to reconcile net earnings to cash
provided from operating activities
Cumulative effect of accounting changes
–
–
587
Depreciation and amortization of property, plant and equipment 8,538 8,349 6,864
Earnings before accounting changes retained by GECS
–
–
–
Deferred income taxes (890) 50 1,417
Decrease (increase) in GE current receivables (360) (849) 534
Decrease (increase) in inventories (578) (468) 874
Increase in accounts payable 1,238 4,090 232
Increase (decrease) in GE progress collections 510 (464) (2,268)
Increase (decrease) in insurance liabilities 1,034 1,959 (729)
Provision for losses on GECS financing receivables 3,841 3,888 3,752
All other operating activities 1,821 (2,699) (2,927)
Cash from operating activities – continuing operations 33,787 30,482 21,840
Cash from operating activities – discontinued operations 3,854 6,002 7,389
CASH FROM OPERATING ACTIVITIES 37,641 36,484 29,229
Cash flows – investing activities
Additions to property, plant and equipment (14,441) (13,092) (9,751)
Dispositions of property, plant and equipment 6,027 5,838 4,918
Net increase in GECS financing receivables (16,954) (15,280) (4,687)
Payments for principal businesses purchased (11,498) (18,703) (14,352)
All other investing activities 6,535 10,785 7,974
Cash used for investing activities – continuing operations (30,331) (30,452) (15,898)
Cash used for investing activities – discontinued operations (4,718) (7,962) (5,945)
CASH USED FOR INVESTING ACTIVITIES (35,049) (38,414) (21,843)
Cash flows – financing activities
Net increase (decrease) in borrowings (maturities of 90 days or less) (4,600) (1,558) (20,559)
Newly issued debt (maturities longer than 90 days) 66,523 58,538 67,719
Repayments and other reductions (maturities longer than 90 days) (53,133) (47,106) (43,479)
Net dispositions (purchases) of GE shares for treasury (4,844) 3,993 726
Dividends paid to shareowners (9,352) (8,278) (7,643)
All other financing activities (1,191) (3,397) 286
Cash from (used for) financing activities – continuing operations (6,597) 2,192 (2,950)
Cash from (used for) financing activities – discontinued operations 478 2,402 (682)
CASH FROM (USED FOR) FINANCING ACTIVITIES (6,119) 4,594 (3,632)
INCREASE (DECREASE) IN CASH AND
EQUIVALENTS DURING YEAR (3,527) 2,664 3,754
Cash and equivalents at beginning of year 15,328 12,664 8,910
Cash and equivalents at end of year 11,801 15,328 12,664
Less cash and equivalents of discontinued operations at end of year 2,790 3,176 2,734
Cash and equivalents of continuing operations at end of year $9,011 $ 12,152 $ 9,930
SUPPLEMENTAL DISCLOSURE OF CASH
FLOWS INFORMATION
Cash paid during the year for interest $(16,446) $(11,907) $(10,910)
Cash recovered (paid) during the year for income taxes (3,254) (1,339) (1,539)
The notes to consolidated financial statements are an integral part of this statement.